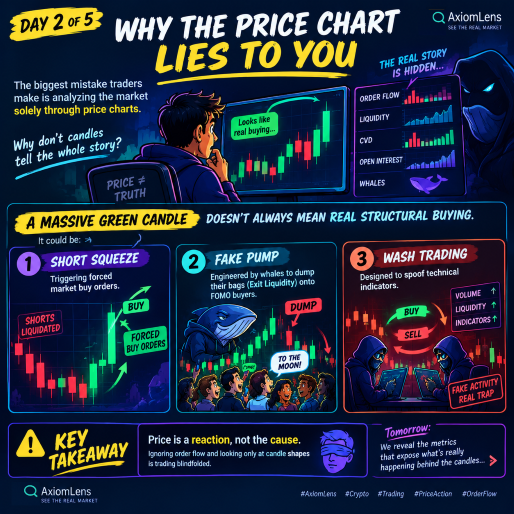
Day 2 of 5 | Why the Price Chart Lies to You
The biggest mistake traders make is analyzing the market solely through price charts.
Why don't candles tell the whole story?
A massive green candle doesn't always mean real structural buying. It could be:
1. A Short Squeeze triggering forced market buy orders.
2. A fake pump engineered by whales to dump their bags (Exit Liquidity) onto FOMO buyers.
3. Wash trading designed to spoof technical indicators.
📌 Price is a reaction, not the cause. Ignoring order flow and looking only at candle shapes is trading blindfolded.
Tomorrow, we reveal the metrics that expose what’s really happening behind the candles... 🔻
Key Words:
AxiomLens, Crypto, Trading, Price Action, Order Flow