How to Read Capitulation Through Exchange Flow Data
Capitulation looks the same on every price chart — a violent crash, maximum fear, and a sharp recovery. But what happens beneath the surface, inside the exchange flow data, tells a story that the price chart alone cannot reveal. Understanding capitulation through the lens of capital flow is what separates informed traders from reactive ones.
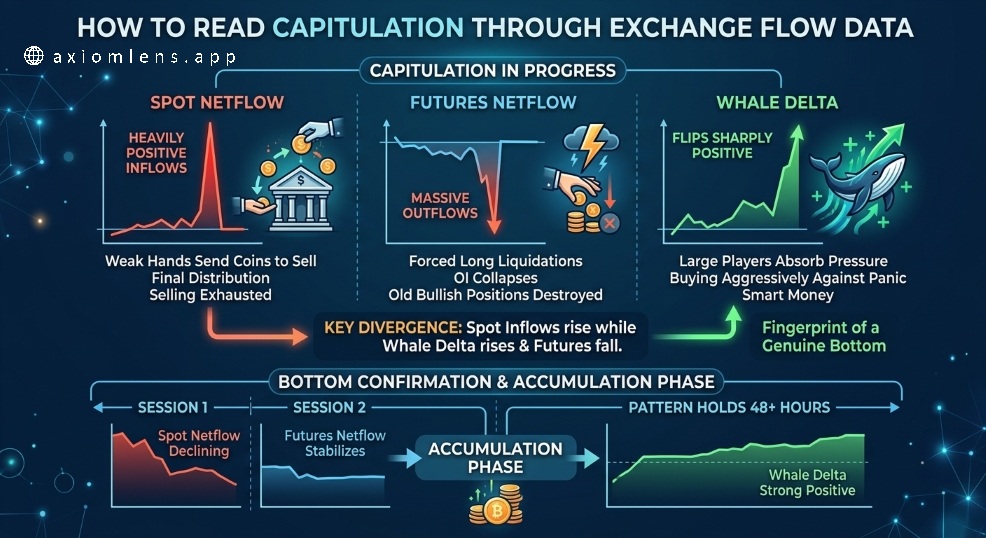
When capitulation begins, three simultaneous flow events occur — and all three must align to confirm a genuine market bottom rather than a temporary pause in a continuing decline.
What the three flows reveal:
Spot Netflow turns massively positive. Coins flood into exchanges at an extreme and sudden rate — often the highest inflow reading in weeks or months. Holders who survived the entire downtrend finally break under the psychological pressure and send their coins to sell at any price. This capitulation inflow is the final wave of supply from weak hands. Paradoxically, the larger and more sudden the spot inflow spike, the closer the market is to exhausting its available sellers.
Futures Netflow shows extreme outflows. Leveraged long positions are being forcibly liquidated across the market. This is not new shorts being opened — it is existing longs being destroyed by margin calls and stop loss triggers. Open interest collapses rapidly as position after position is wiped out. The futures market is not creating new bearish pressure. It is eliminating the accumulated bullish leverage that built up during the preceding uptrend. Once this leverage is gone, the selling mechanism that drove the cascade is removed.
Whale Delta flips sharply positive precisely at the moment spot inflow peaks and futures liquidations are at their most extreme. This is the most critical and reliable signal in the entire capitulation pattern. While retail participants are panic selling at any price and leveraged longs are being forcibly closed, large players are stepping in as the buyer of last resort — absorbing every unit of panic supply with aggressive market orders. The divergence between the direction of flows and the direction of whale delta is the fingerprint of a genuine bottom forming.
The confirmation sequence:
Bottom confirmation arrives when spot netflow begins declining from its peak — sellers are literally running out of coins to send. Futures outflow stabilizes as the last leveraged positions are cleared. And whale delta maintains its positive reading across two or more consecutive sessions, confirming that accumulation has replaced liquidation as the dominant market dynamic.
The rule:
One session of flow data is never sufficient. Wait for the pattern to hold across at least forty eight hours before treating it as a confirmed bottom signal. Patience at capitulation bottoms is not weakness — it is the discipline that separates profitable entries from premature ones.