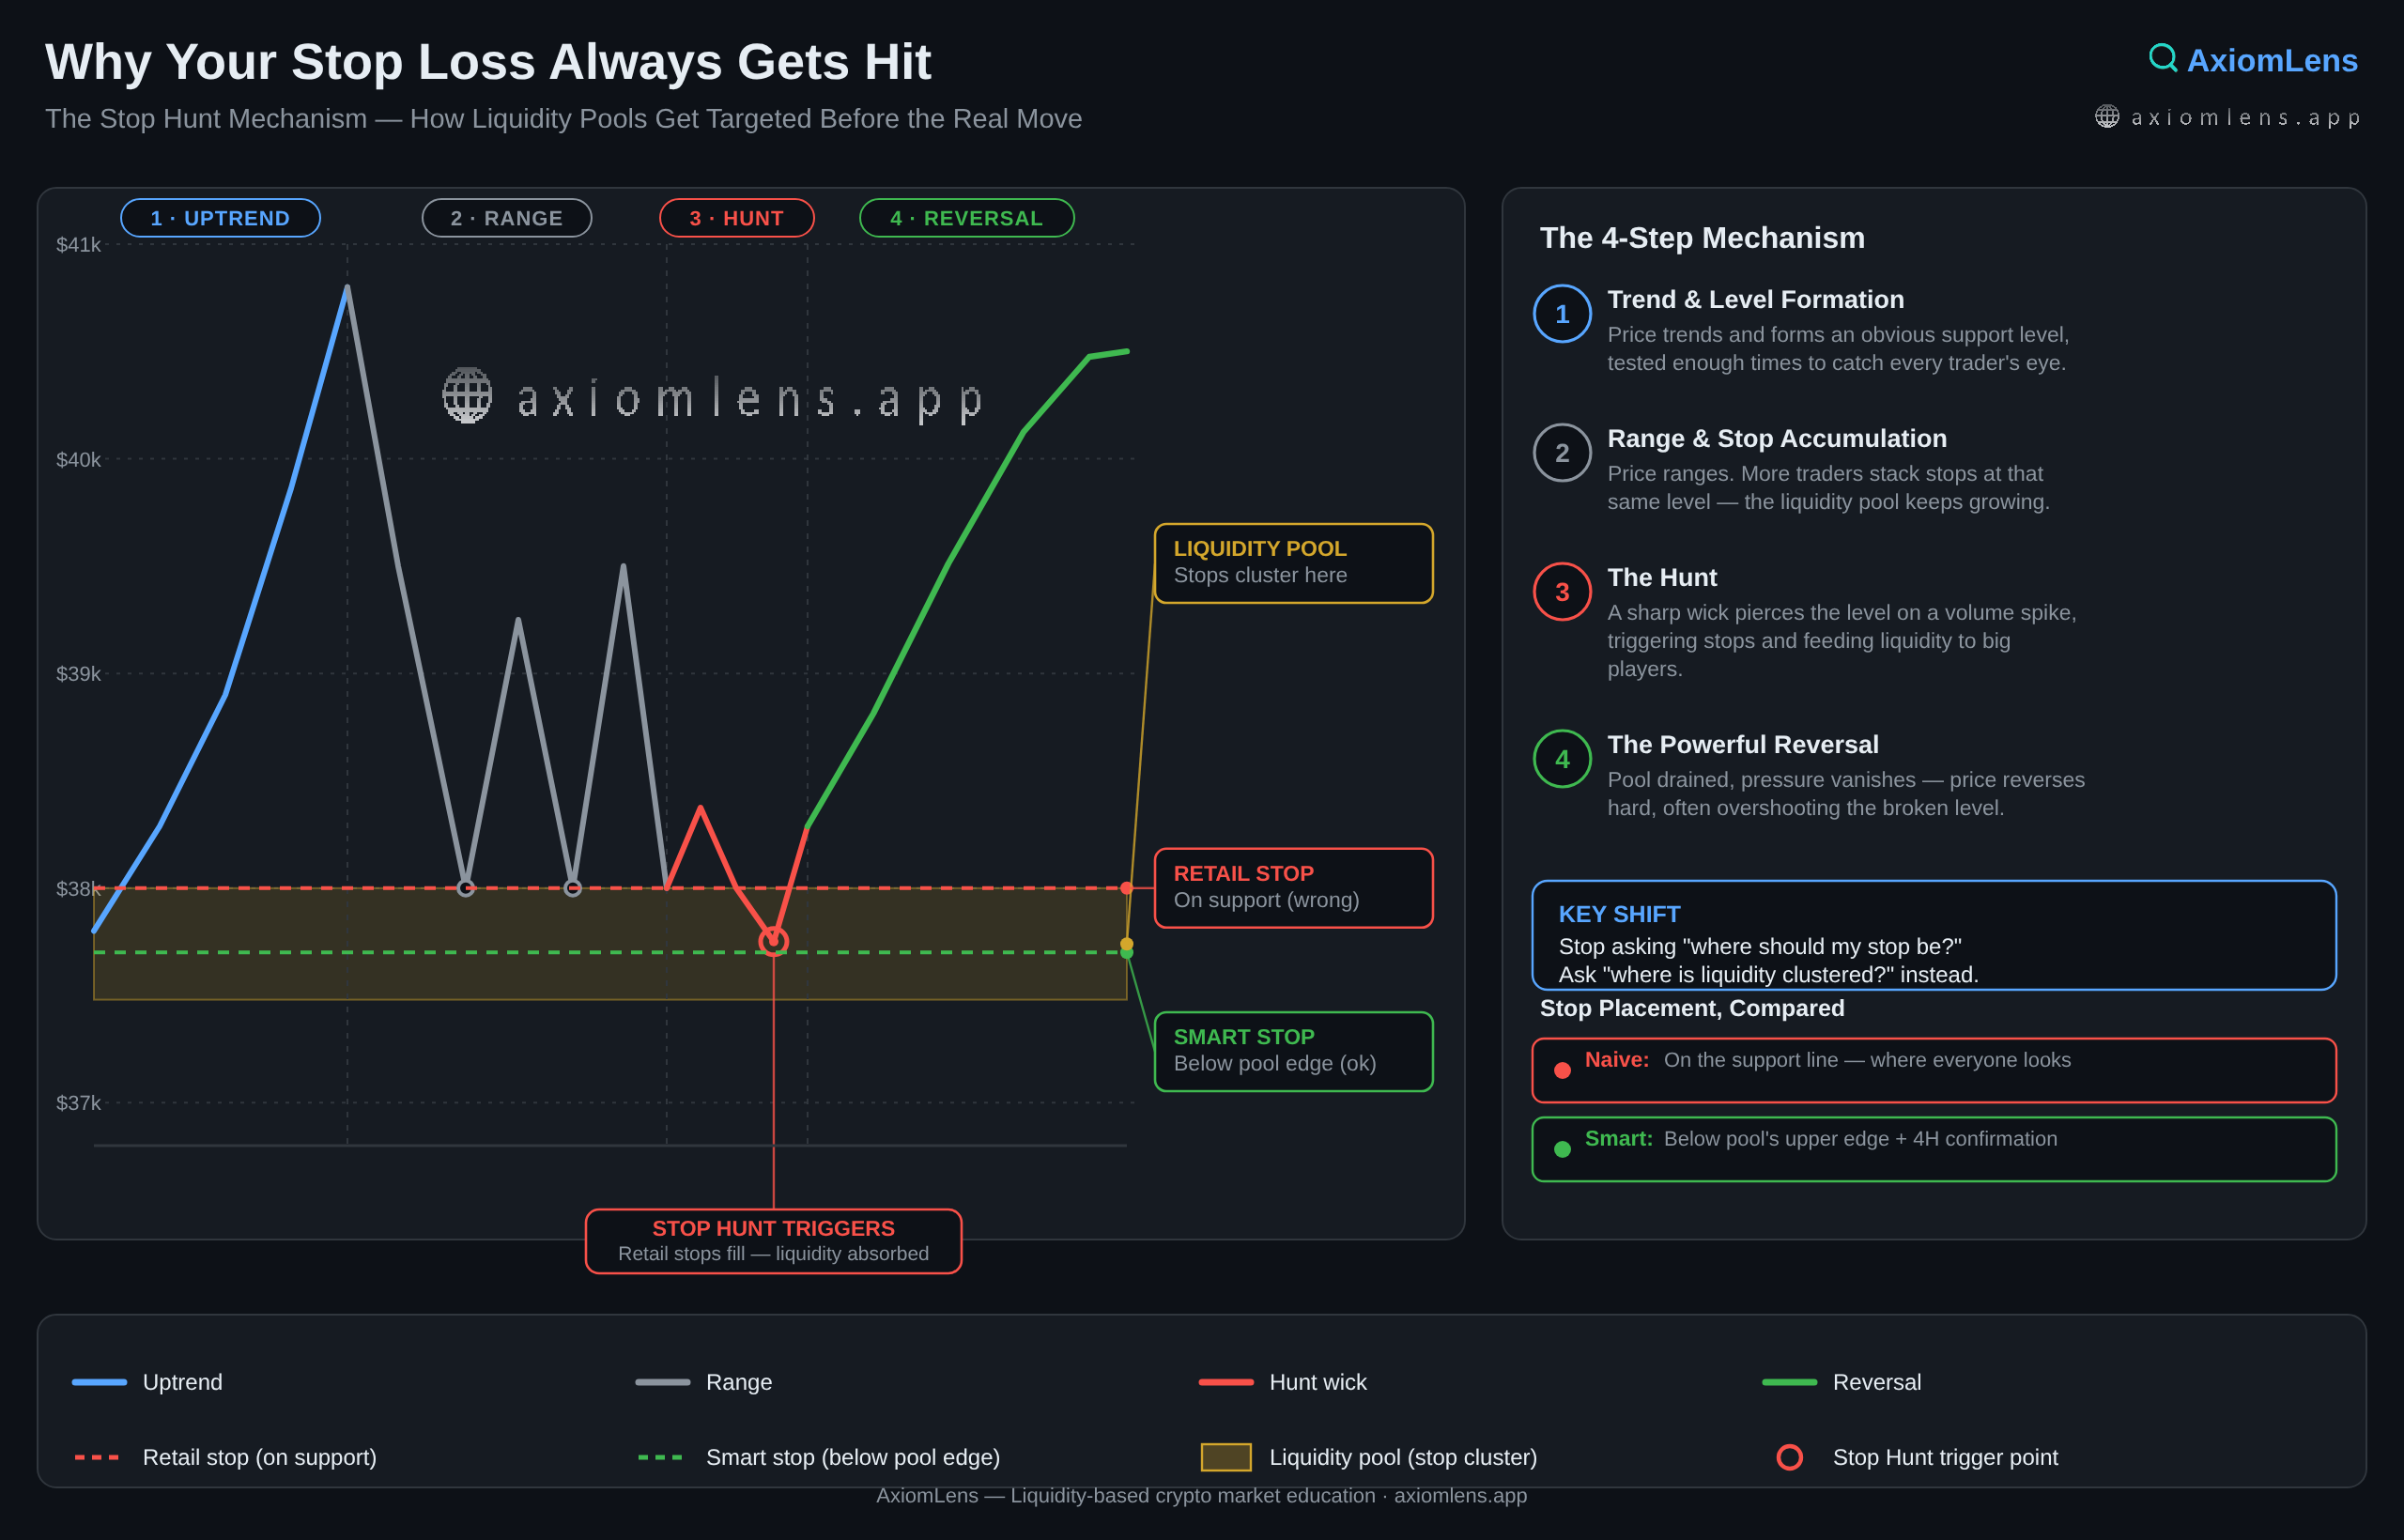
Why Your Stop Loss Always Gets Hit?
Almost every trader has lived this moment: you place your stop loss just below an "obvious" support level, price travels exactly to that point, your stop fires, and minutes later the market moves exactly in the direction you originally expected — just without you in the trade. This isn't bad luck. It has a name — Stop Hunt — and it's one of the most predictable behaviors in leveraged markets.
This article isn't about which tool to use or which settings to check. It's about the mechanism: why this happens, why almost every retail trader falls into the same pattern, and how to shift your thinking so you stop being the liquidity and start anticipating it.
A Market Has Two Sides
Here's something easy to forget: every trade in a futures market has a counterparty. When you go long, someone or something is short on the other side. When your stop loss triggers, that position becomes a market sell order — and that order supplies exactly the liquidity the counterparty needs to close or open their own position.
Put simply: stop losses clustered at a single price level form a liquidity pool. And large players, institutional desks, and trading algorithms don't see that pool as an obstacle — they see it as a target.
This is where the Stop Hunt concept comes from: price moves toward zones packed with stop losses not to break a trend, but to absorb liquidity before the real move actually begins.
Why "Obvious" Levels Are the Most Dangerous?
The problem starts because most traders place their stop exactly where technical logic says they should:
• Just below a clearly marked horizontal support line
• Just below the 50-day or 200-day moving average
• Right on a round number (like $40,000)
• Just below the low of one large candle
These levels are dangerous precisely because they're logical and obvious. When thousands of traders reason the same way at the same time, their stops cluster into a narrow price band. That clustering creates a large, predictable target for liquidity-hunting moves.
In other words: if your stop sits where "everyone" would guess it sits, you are the liquidity pool the market is hunting.
The Stop Hunt Mechanism, Step by Step
A classic Stop Hunt pattern typically unfolds in four phases:
Phase 1 — Trend and Level Formation. Price moves in an uptrend or downtrend and forms a clear support or resistance level along the way — one that stands out to most traders because price has tested it multiple times.
Phase 2 — Range and Stop Accumulation. Price consolidates in a range for a while. During this period, more traders open positions and place their stops right near that support level. The liquidity pool grows larger and larger.
Phase 3 — The Hunt. Price suddenly — usually with a sharp move — pierces below the support level. This move is often accompanied by a spike in volume and a long candle. The accumulated stop losses trigger one after another, supplying the liquidity large players need to enter.
Phase 4 — The Powerful Reversal. Once the liquidity pool is drained, the artificial selling pressure disappears, and price reverses with the same speed it dropped — often overshooting the broken level. Traders who got stopped out now watch from the sidelines as the market moves exactly the way they originally expected.
This pattern isn't random. It's a repeatable structure that emerges from the collective behavior of retail traders.
The Common Mistake: Stop on the Support Line, Not Beyond the Liquidity Pool
The biggest mistake most traders make is placing their stop loss right on the support line instead of somewhere that actually clears the liquidity pool.
The difference between these two approaches matters:
• Naive stop placement: Right below the support level, exactly where everyone can see it.
• Smart stop placement: Slightly below the upper edge of the nearest heavy liquidity pool, a point the hunt either doesn't reach or, if it does, the reversal clears quickly.
This means you need to build in extra distance between the support line and your actual stop — distance that accounts for the dense liquidity cluster itself, rather than placing your stop right in the middle of that cluster.
One more critical point: re-entering a position after a hunt move should wait for 4-hour candle confirmation, not an instant reaction. Many hunt moves look exactly like a real breakdown in the moment. Only a full candle close in the reversal direction gives you reasonable confidence that what you just saw was a Stop Hunt, not an actual structural break.
Why Do Large Players Do This?
This behavior isn't a conspiracy, and it isn't illegal — it's an inherent part of how leveraged markets and order books function. Large players need liquidity to open sizeable positions. Clustered stop losses supply exactly the liquidity needed to execute large orders without excessive slippage.
Put simply: a liquidity hunt move is a way of "clearing out" weak hands from the market before the real move begins.
How to Shift Your Thinking?
The key shift is moving from asking "where should my stop be?" to asking "where is liquidity clustered, and why?"
Once you understand where most traders place their stops — usually right below obvious levels — you can:
1. Expect a brief penetration below that level rather than interpreting it as a genuine breakdown.
2. Set your own stop with enough distance from that dense cluster.
3. Even use the pattern to your advantage — waiting for the hunt to complete and entering in the reversal direction, instead of entering too early in the original trend direction.
This shift in perspective turns you from a reactive trader who becomes the liquidity into one who anticipates the market's collective behavior.
The Practical Next Step
Understanding the Stop Hunt mechanism is half the equation. The other half is having a tool that actually shows you these liquidity pools before price reaches them. To learn how to use the liquidation heatmap in practice — identifying these zones and setting a genuinely smart stop loss — see our dedicated heatmap guide at axiomlens.app.
O. H.
Founder, AxiomLens
🌐 axiomlens.app
________________________________________
This article is part of the AxiomLens educational series — crypto market analysis built on liquidity structure and capital flow, not prediction.