What Funding Rate Tells You — and When to Take It Seriously?
Most traders glance at the funding rate alongside price but never really know when it matters. That small number — usually oscillating between 0.01% and 0.1% every 8 hours — is one of the most direct signals the futures market gives you about collective trader sentiment. But like most indicators, the problem is that it carries no important message the vast majority of the time. It only becomes genuinely meaningful in specific, identifiable moments.
This article isn't about where to find the funding rate on a given exchange. It's about the logic behind that number — and when to treat it as a serious input in your decision-making.
What Funding Rate Is and Where It Comes From?
In Perpetual Futures markets, unlike traditional futures contracts, there is no expiration date. That creates a mechanical challenge: what keeps the contract price anchored to the real (spot) market price?
The answer is the funding rate mechanism.
Every 8 hours (on most exchanges), traders holding the dominant side pay traders on the other side:
• When funding is positive: longs pay shorts
• When funding is negative: shorts pay longs
This mechanism pushes the market back toward spot price. High positive funding makes holding a long position expensive, creating an incentive to sell and pull the contract price back toward spot.
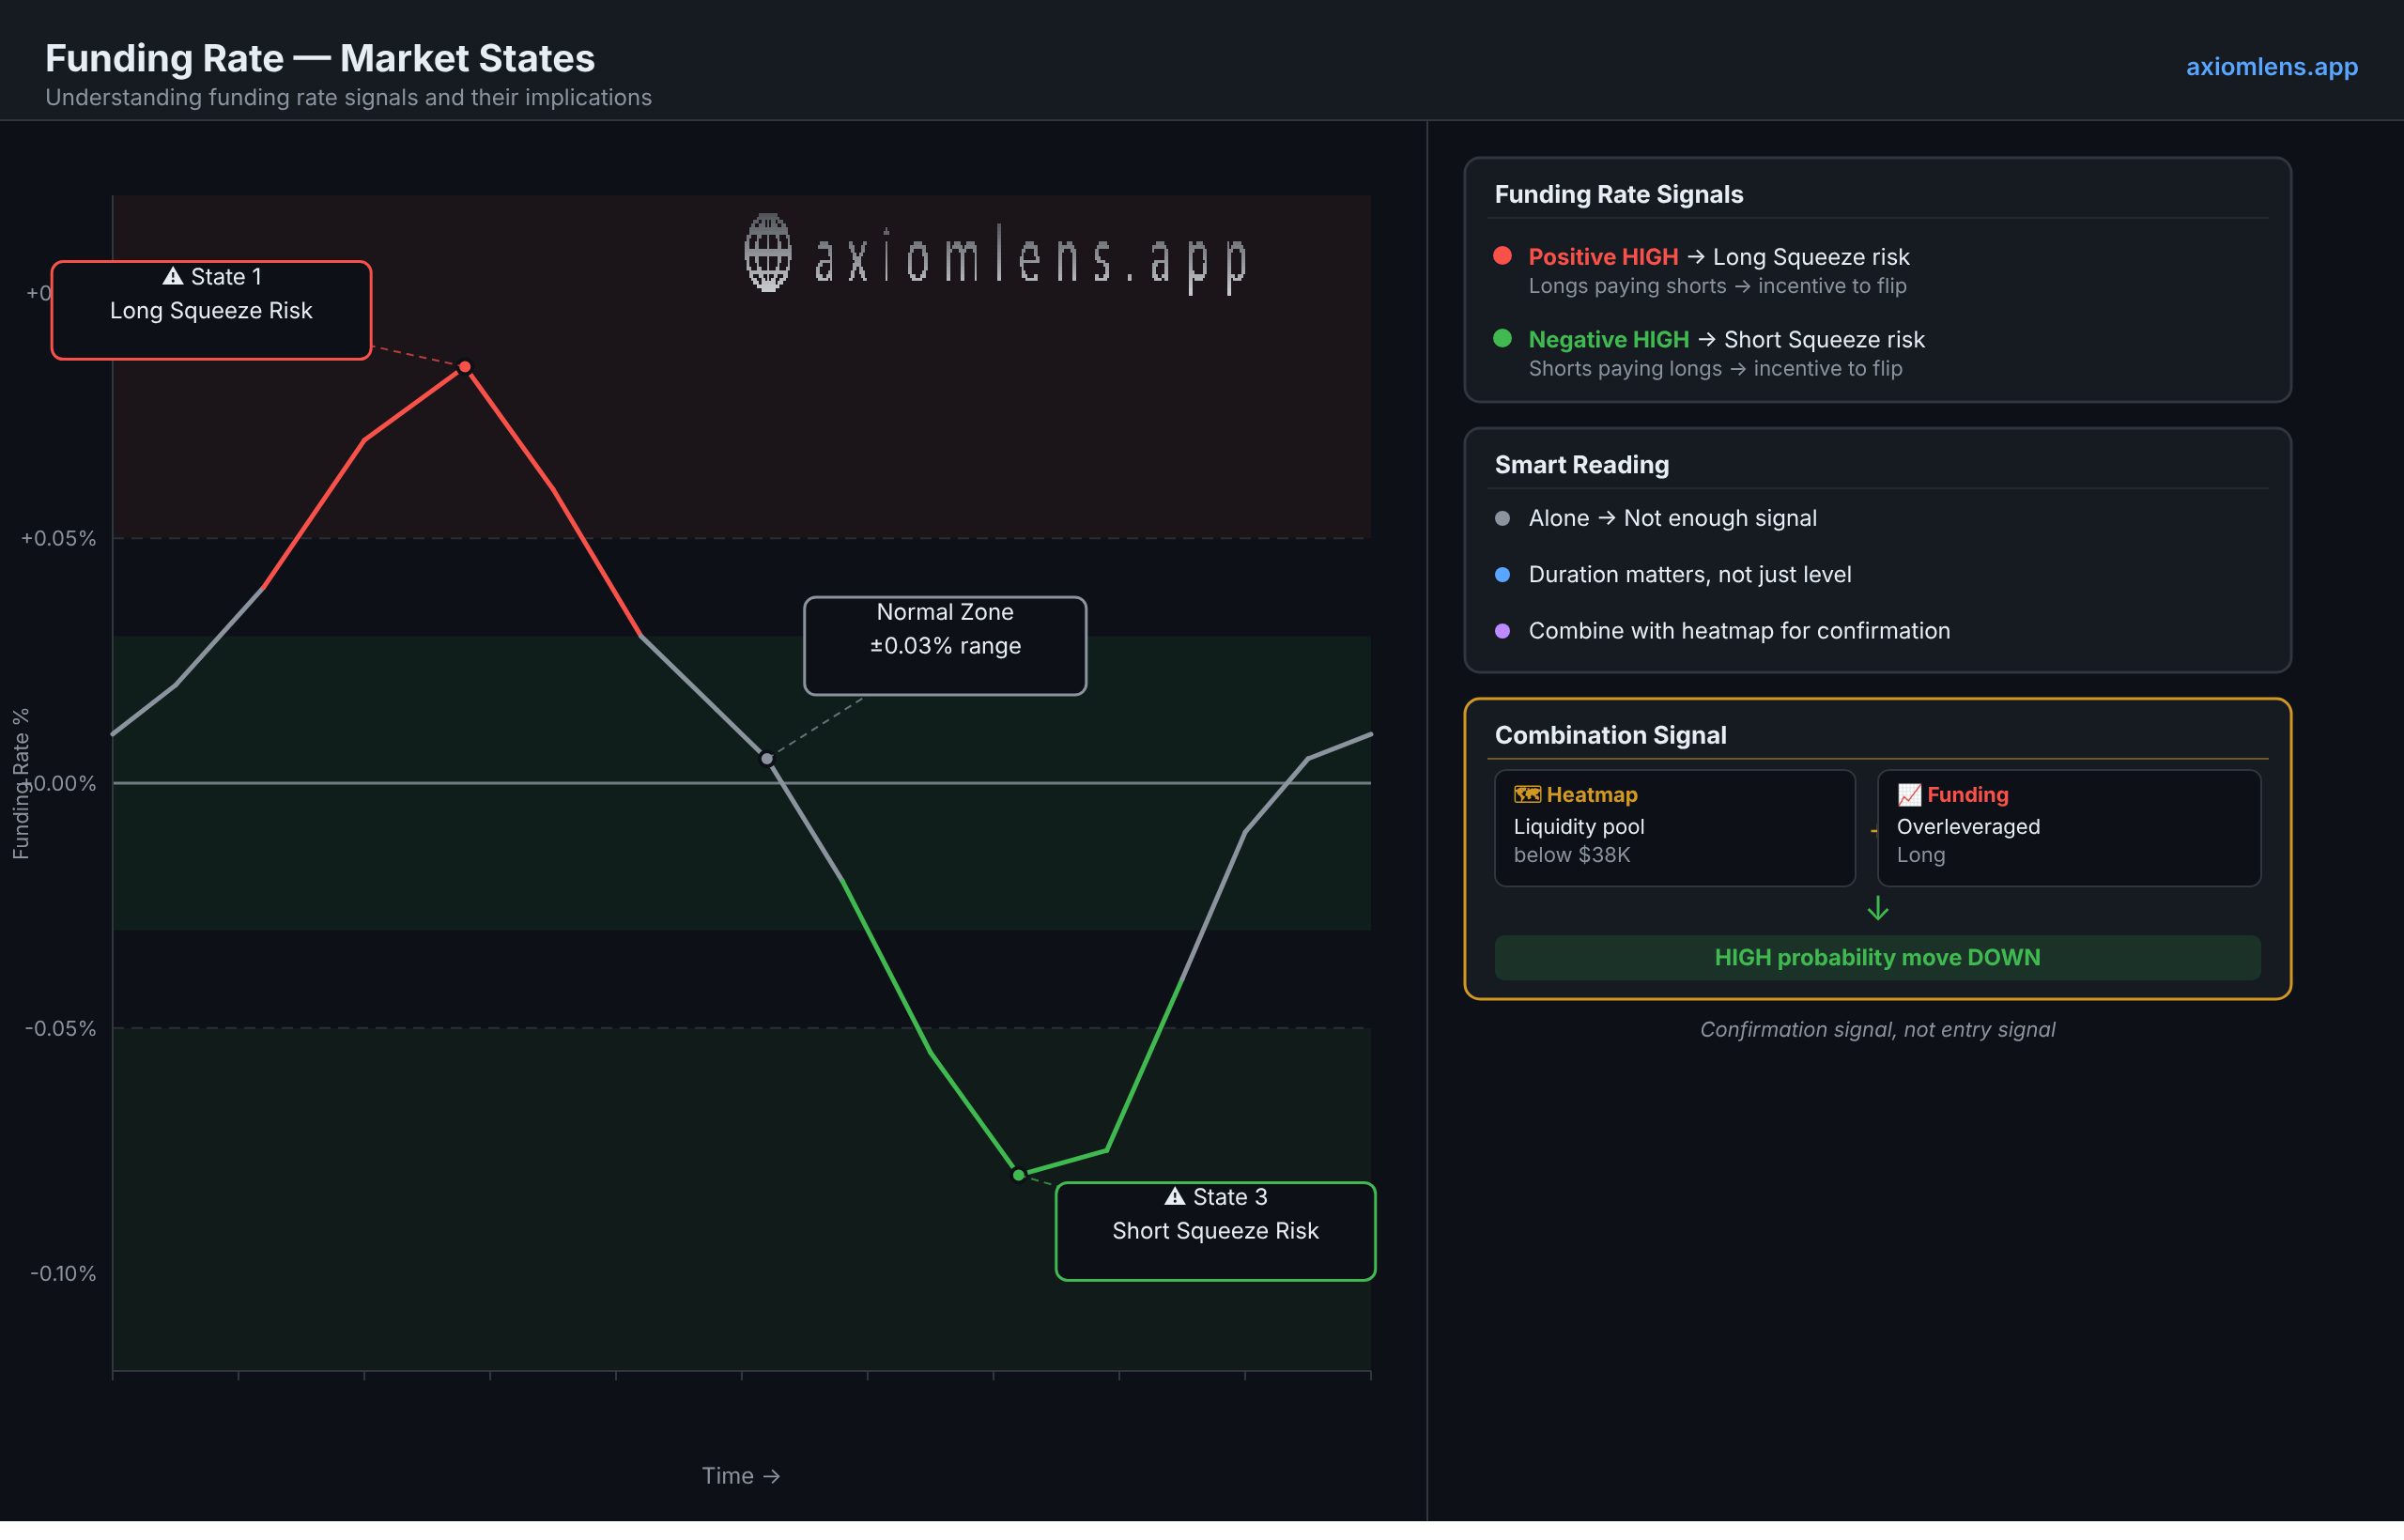
What Positive Funding Actually Means?
High positive funding signals that there are far more longs than shorts in the market. The market has become what traders call "overleveraged long."
On the surface this seems like good news — everyone is bullish! But from a market structure perspective, it's a warning:
• When everyone is long, who is left to buy and push price higher?
• Even a small corrective move can trigger a cascade of liquidations
• Large players know exactly where the majority of the market is positioned — and this is precisely the setup for a Long Squeeze
What Negative Funding Actually Means?
Deeply negative funding signals short dominance — the market has become "overleveraged short."
This carries its own warning:
• When the majority is short, any positive catalyst or upward movement can trigger a Short Squeeze
• Traders caught short are forced to buy to close their positions — that forced buying itself pushes price higher
• Large players may deliberately nudge price upward to trigger that chain reaction
When Funding Is "Normal"?
Here's something worth stating plainly: most of the time, the funding rate carries no meaningful signal.
Funding in the range of 0.01% to 0.03% is completely normal during a crypto bull market. Those numbers simply reflect a mild tilt toward longs — which is entirely expected and harmless in an uptrend.
The real risk begins when:
• Funding stays elevated for hours or days (not just a brief spike)
• Funding rises against the prevailing trend (strongly positive funding during a downtrend, for instance)
• Funding spikes sharply and suddenly
Four Key States to Recognize
State 1: High funding + price near highs The most dangerous combination. Everyone is bullish, everyone is long, and price is at the top of its range. This setup often precedes a sharp correction or a Long Squeeze.
State 2: High funding + price consolidating (range-bound) This can signal an incoming Stop Hunt (see the previous article). Many longs plus a range equals a large liquidity pool building below current price.
State 3: Deeply negative funding + price near lows Short Squeeze risk is elevated. Holding a short here is costly, and any small catalyst can create buying pressure that compounds on itself.
State 4: Funding near zero + price consolidating The most neutral state. The market is balanced between both sides. This often precedes a large directional move — but the direction itself isn't readable from funding alone.
Why Funding Alone Is Not Enough
This is where most traders go wrong: high funding does not mean "sell now."
Funding can remain elevated for months during a strong bull trend. If you go short every time funding reaches 0.1%, you'll take heavy losses in a genuine bull market.
Funding is a confirmation signal, not a standalone entry signal. Its credibility rises when:
1. Confirmed by price structure: Is price near an important resistance level or a major liquidation cluster?
2. Consistent with volume: Is the high funding backed by real volume, or is it a temporary anomaly?
3. Sustained over time: A single 8-hour spike is very different from three days of persistently elevated funding
The Practical Point: How to Weigh Funding in Your Decisions
Funding rate acts as a moderating weight in decision-making, not a final verdict:
• Before opening a long: Is funding at saturation levels? If yes, entry risk is higher — either widen your stop or reduce position size.
• Before opening a short: Is funding deeply negative? If yes, Short Squeeze risk is elevated — shorting here carries extra risk.
• While holding a position: If funding starts rising against your position's direction, treat it as a flag for reassessment — not necessarily an immediate exit signal.
The Connection to the Liquidation Heatmap
If you've read the liquidation heatmap article, you know that tool shows where liquidations are clustered. Funding rate adds another layer: how much the market is saturated on one side.
Combining these two signals is powerful:
• The heatmap says: "There's a large liquidity pool below $38,000"
• Funding rate says: "The market is currently heavily overleveraged long"
• Conclusion: The probability of a move down to absorb that liquidity is meaningfully higher
This is exactly what AxiomLens focuses on — not prediction based on a single signal, but identifying moments when multiple structural signals are aligned in the same direction.
Takeaway
Funding rate is the simplest indicator for reading futures market sentiment — but like any indicator, it only becomes meaningful in the right context.
Learn to:
• Read funding as background context, not as a signal
• Pay attention to how long it stays extreme, not just the instantaneous level
• Combine it with price structure and liquidity to understand its actual weight
To see funding rate alongside the liquidation heatmap and other structural signals, explore the AxiomLens tools at axiomlens.app.
O. H.
Founder, AxiomLens
🌐 axiomlens.app
________________________________________
This article is part of the AxiomLens educational series — crypto market analysis built on liquidity structure and capital flow, not prediction.