Whale Delta: Reading What the Big Players Are Doing from the Cumulative Chart
If you could ask a futures market only one question, it might be this: is big money buying or selling? Price doesn't answer that directly. Price can climb while the largest players quietly exit the move. Whale Delta is one of the few indicators that exposes exactly this behavior.
At AxiomLens it holds a special place. It is one of the six indicators used to evaluate and select a scenario, and one of the three core indicators that define the capital-flow and liquidity-behavior regime. This article explains why, and more importantly, how to read it from the cumulative chart.
What Whale Delta Actually Is?
Delta is the difference between aggressive buying and aggressive selling. Whale Delta runs the same calculation only for large orders and large traders: how much net buying and how much net selling they have done over a given interval.
The cumulative chart adds these values up over time. The result is a single line that tells you where the net flow of the largest players has stood since the start of the displayed window. Above zero means they have been net buyers overall; below zero means net sellers.
A technical note: the exact definition of a "whale" (the order-size threshold) and the calculation method depend on the data provider. Read the tool's own description and interpret the output on that basis.
Two Things to Read Separately: Color and Slope
Most mistakes reading this chart come from putting all the attention on color.
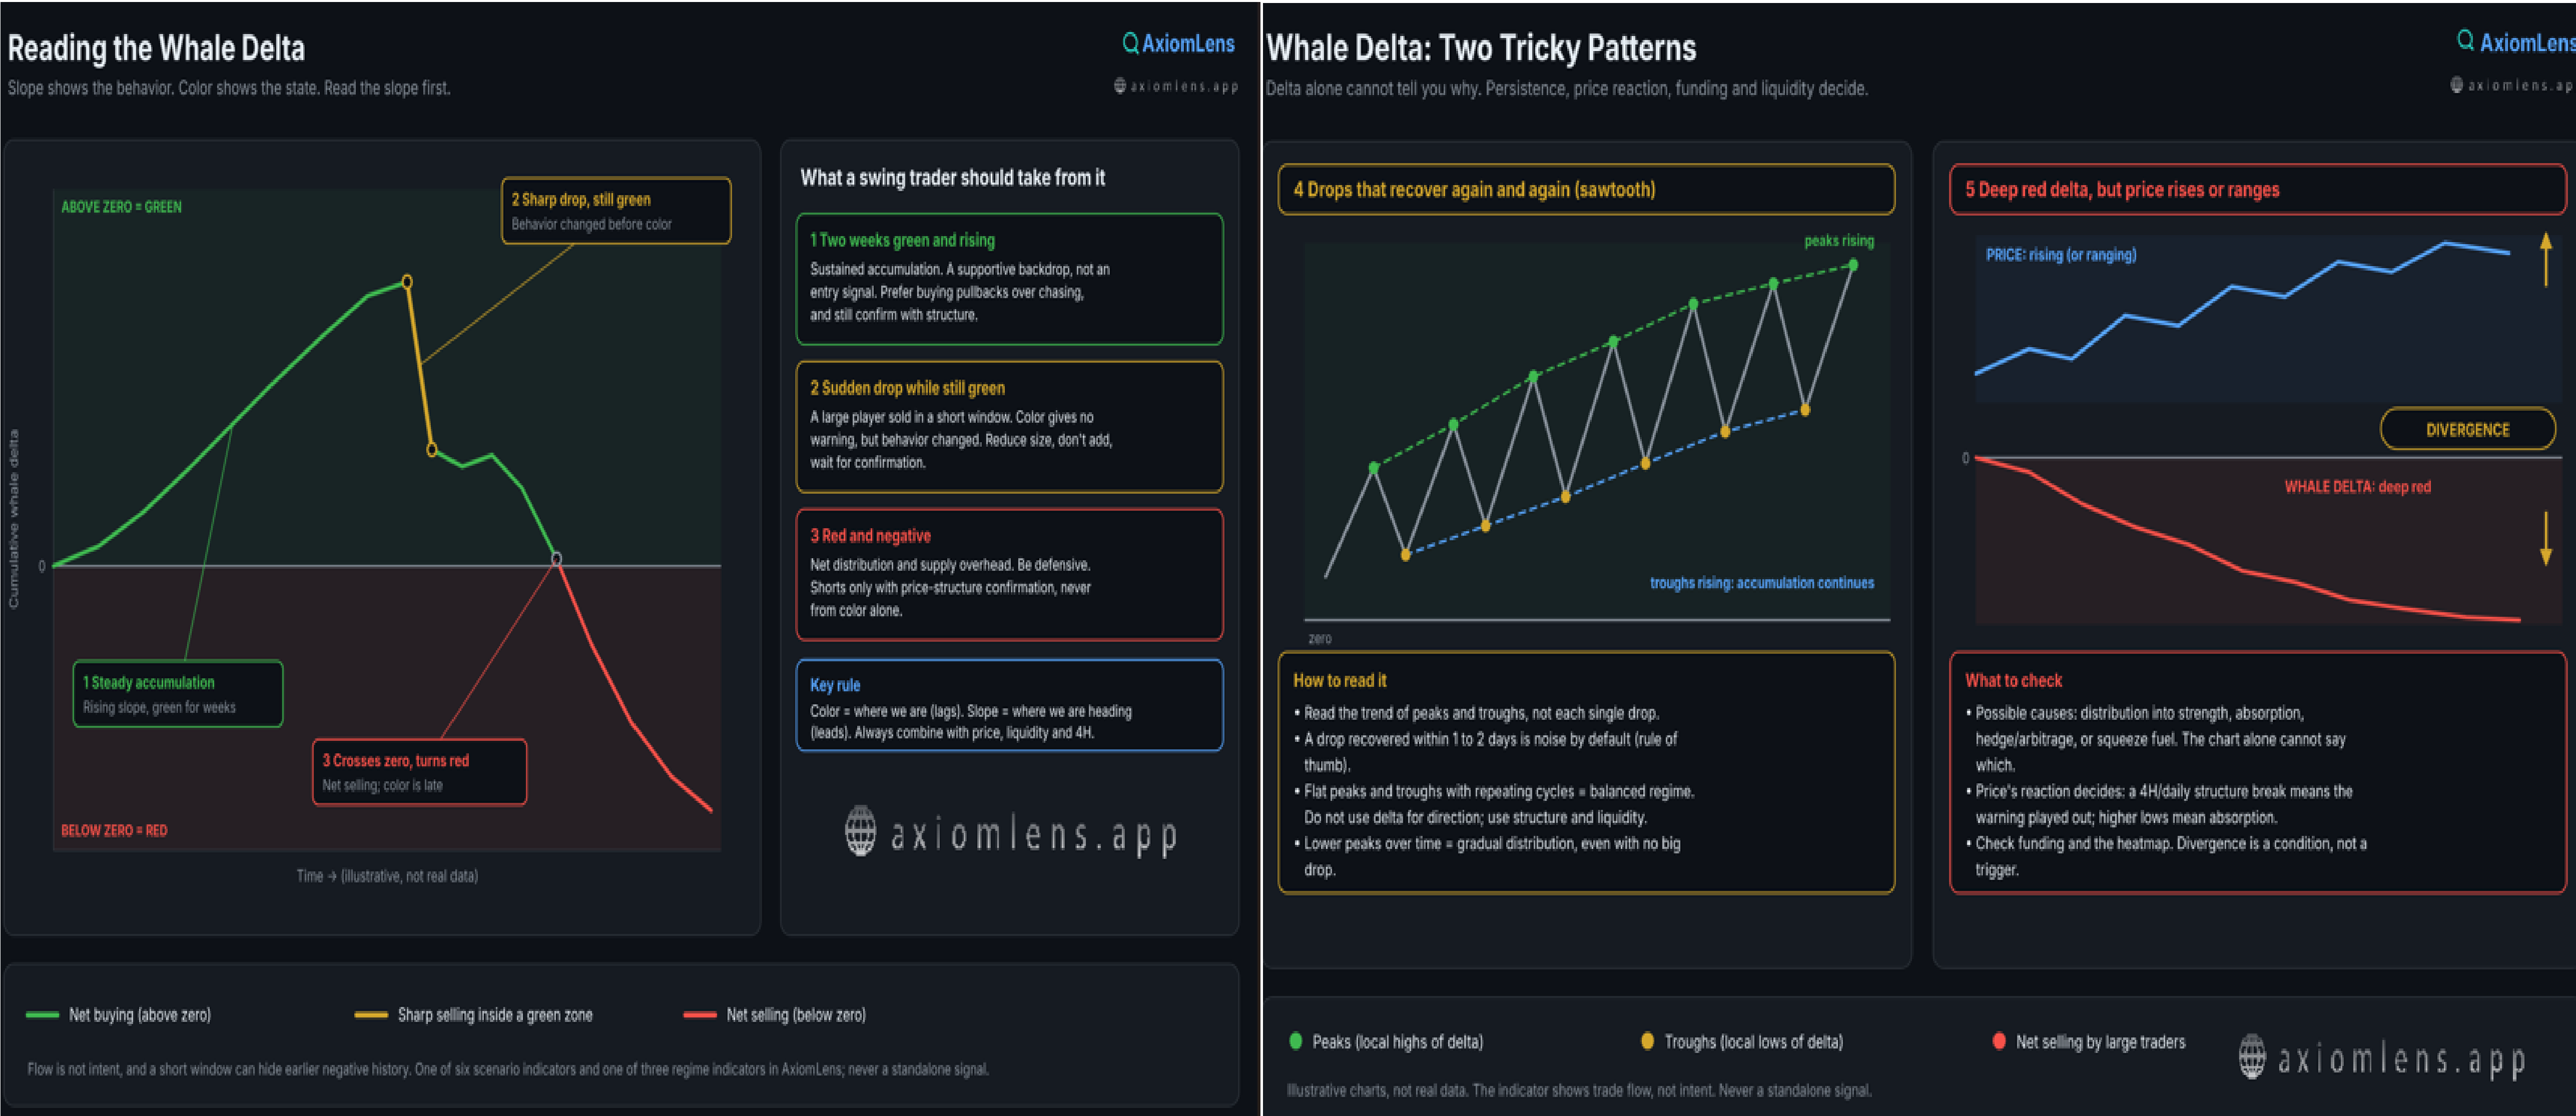
Color shows the state. Green means the cumulative value is above zero; red means below. But because the value is a running sum of the past, the color always changes late.
Slope shows the behavior. A rising line means whales are net buying right now. A flattening line means buying has stopped. A falling line means net selling. Slope is what changes before color does.
That gives this article its simple rule: read the slope first, then the color. Color tells you where you are; slope tells you where you're heading.
Scenario 1: Two Weeks of Green and Rising
Suppose the line has been above zero for two weeks, stays green, and keeps sloping upward.
What it means: the largest participants are accumulating steadily. This is not a one-day or one-candle effect; it reflects a relatively durable decision. In regime logic, it adds weight to bullish scenarios.
What it means for a swing trader: this is not an entry signal, it is a supportive backdrop. If price structure and liquidity also agree, buying pullbacks makes more sense than shorting. But it does not mean chasing vertical moves; whales generally accumulate in cheaper zones, not at peak excitement.
Scenario 2: A Sudden Drop While the Chart Is Still Green
This is the most important case, because most traders ignore it. The line has climbed for weeks, then abruptly falls on a steep slope, yet it is still above zero and still green.
What it means: one or more large players sold a significant amount in a short window. Because the line is still positive, the color gives no warning, but the behavior has changed. Whales have shifted from steady buyers to sellers, which is usually the first sign of distribution.
What it is not: necessarily a top, and not a short signal. A sudden drop can be profit-taking, a transfer between exchanges, or the closing of a hedge. What it means is that the "whale support" condition no longer holds, and you should act with more caution.
What it means for a swing trader: reduce the size of new positions, avoid adding to open longs, and wait for confirmation. Confirmation means seeing whether the slope recovers or keeps falling after the drop, together with price structure on the 4H and daily timeframes.
Scenario 3: The Chart Turns Red and Negative
When the line crosses zero and turns red, it means that across the whole window cumulative net selling by the largest players exceeds their net buying.
What it means: there is heavier supply overhead. The market is no longer getting support from large buyers, and each rally runs into their selling. In regime logic, this weakens bullish scenarios.
What it means for a swing trader: defensive mode. Be stricter about new longs, and if you are considering shorts, enter only with price-structure confirmation, not merely because the chart is red. And remember that turning red is also late; much of the move may already have happened. That is why reading the slope in Scenario 2 is more valuable than seeing red in Scenario 3.
Scenario 4: Repeated Drops and Recoveries (the Sawtooth)
Sometimes the line suddenly drops, rebuilds the next day and climbs back, and this cycle repeats several times. This pattern wrecks analysis because every drop looks like "the start of distribution" and every recovery looks like "accumulation again."
What it means: whale behavior here is oscillating, not directional. Because the indicator sees trade flow and not intent, there are several plausible explanations: portfolio rebalancing, market-maker inventory management, opening and closing hedges, or transfers between venues. The chart cannot tell you which is true; what matters is that these moves are not a reliable directional decision.
What to pay attention to:
• Instead of each drop, read the trend of the peaks and troughs. If each peak and each trough is higher than the last, accumulation continues despite the drops. If peaks are getting lower, gradual distribution is under way, even without one large drop.
• Use persistence as the test. Treat a drop that is recovered within a day or two (a few 4H candles) as noise by default. A drop that is not recovered across several daily closes is a real change in behavior. This is a rule of thumb, not a law.
• Judge the drop against the total build-up. A small swing relative to the whole accumulation is not meaningful.
• If the cycles keep repeating and the net trend is flat, the regime is "balanced," neither accumulation nor distribution. Don't use delta for direction here; rely on price structure, liquidity and the range edges.
• Don't react instantly. After each drop, set a confirmation window, then decide.
Scenario 5: Deep Red, but Price Is Rising or Ranging
The line has fallen below zero, even very far below, but price isn't falling: it either keeps rising or stays in a range. This is a divergence, and it has several possible explanations. The indicator alone cannot say which is right:
1. Distribution into strength: whales are selling into retail demand. Price holds for now, but the rally is fragile.
2. Absorption: big selling is happening, but larger buyers are absorbing it. The indicator only sees trades above its own threshold from its own data source. Buying split into smaller orders, or flows outside the data source (OTC, for example), won't show up.
3. Hedge or arbitrage: selling futures against held spot. Delta turns negative without whales being bearish.
4. Squeeze fuel: if shorts are building while price rises, those same shorts later become forced buyers and push price higher still.
What to pay attention to:
• Price's reaction is the final judge. If whales sell and price doesn't fall, their selling is being absorbed. That is neither bullish nor bearish by itself; wait for confirmation. A structure break on the 4H and daily (losing the last important low) means the warning played out. A continued sequence of higher lows means absorption.
• Put funding rate next to it. High positive funding + red delta + rising price means crowded longs and selling whales, the riskiest combination. Negative funding + red delta + rising price means shorts are under pressure and squeeze risk is high; shorting here is dangerous.
• Check the heatmap. Liquidity above price (a cluster of shorts) can pull price up and then send it back. Look at liquidity on both sides.
• Duration matters, but it is not a trigger. Divergence is a condition, not a timing signal; it can last weeks. Shorting just because of it is a poor trade.
• If price is in a range, deep red delta means selling pressure is either being drained gradually or absorbed. The range edges and liquidity sweeps (as covered in the Stop Hunt article) are the decision points.
For a swing trader: don't take new longs carelessly and reduce size, but consider shorts only after a structure break.
Limits and Common Mistakes
The window only shows part of the chart. Zero is a fixed reference, and the sign of the line (positive or negative) does not change when you change the window; negative is always negative. But a short window may simply not bring the negative (or positive) part into view. In a two-week window you might see only a green line, while a longer window reveals the line was deeply negative until a few weeks ago and this rise is only a recovery from that depth. So look at a longer window first to understand the overall level and context, then read the slope on your swing window (1 to 20 days).
You see flow, not intent. Whale selling could be part of a market-neutral or arbitrage strategy. The indicator shows behavior, not the reason for it.
One big player can move the line. Especially in smaller assets, a single large trade can distort the slope. Look for repetition and persistence, not a single point.
It is not enough alone. This is a regime input, not a trade signal. Its credibility rises when funding, liquidity on the heatmap, and price structure tell the same story.
How It Fits with the Other Tools
Whale Delta tells you who is moving. The liquidation heatmap tells you where liquidity is clustered, and funding rate tells you how far the market is leaning to one side. When all three point the same way, the scenario strengthens. When they conflict, the conflict is itself information: reduce size and wait.
Takeaway
• Color is the state; slope is the behavior. Read slope first.
• Two weeks of green and rising means sustained accumulation, a supportive backdrop for bullish scenarios.
• A sudden drop while still green means behavior has changed even though color hasn't warned you. Caution and smaller size.
• Red and negative means net distribution and supply overhead, but it arrives late.
• Repeated drops and recoveries mean oscillating behavior; look at the trend of peaks and troughs and at persistence, not at each drop.
• Deep red with rising or ranging price means divergence; it can be distribution, absorption or a hedge. Price, funding and the heatmap decide which.
• None of these is an entry signal; all are regime inputs.
After reading this article, you may feel that interpreting whale delta correctly means watching price, funding, open interest and liquidity at the same time, and worry about making mistakes in your analysis. Don't worry: AxiomLens is designed for exactly this. It analyzes whale delta simultaneously alongside the liquidation heatmap, funding rate, open interest and the other effective indicators, and builds scenarios and decisions from how those signals align or conflict. You can lean on that multi-layered analysis to decide with more confidence.
O. H.
Founder, AxiomLens
🌐 axiomlens.app
________________________________________
This article is part of the AxiomLens educational series and is for education only, not financial advice. Crypto market analysis built on liquidity structure and capital flow, not prediction.