Open Interest: The Fuel of Perpetual Futures, How to Read It Against Price?
Price tells you where the market is. It doesn't answer this question: how much leveraged money is standing behind that price? The answer lives in an indicator most traders look at but few read correctly: Open Interest (OI).
In the earlier articles, the heatmap showed where liquidity is clustered, funding rate showed how far the market leans to one side, and whale delta showed who is moving. Open interest is another piece of the same puzzle: the total size of open positions. This article makes three things clear: what OI actually is and why it matters in perpetual futures trading, what different OI-versus-price combinations tell you, and what role OI plays in interpreting funding rate.
What Open Interest Actually Is?
-----------------------------------------
OI is the total size of open, unclosed positions at a given moment. It does not count the number of traders or the number of trades; it measures the combined size of active positions. Every open contract has one buyer (long) and one seller (short), and OI counts each contract only once, not separately for the long and the short.
Two Ways It Is Displayed: Dollars and Coins
----------------------------------------------------------
On analytics platforms (such as Coinglass, CoinAnalyze and TradingView) and on exchanges themselves, OI usually appears in two forms:
• In dollars (notional value): the total value of open positions in USD or USDT. Example: if the total open positions in Bitcoin on an exchange are worth $20 billion, dollar OI is $20B.
• In coins (coin units / contracts): the total amount of the asset or number of contracts, independent of price changes. Example: open positions totaling 200,000 BTC.
Why compare both? When price rises sharply, dollar OI goes up even if coin OI hasn't changed. That means no new money entered the positions; price merely raised the value of the existing ones. So to detect fresh capital entering the derivatives market:
• Dollar OI and coin OI rising together shows new liquidity and new positions entering.
• Dollar OI rising without coin OI is mostly a price effect, not fresh capital.
• Falling OI shows positions being closed (liquidations or profit-taking) and liquidity leaving the derivatives market.
Three Points That Often Get Mixed Up
--------------------------------------------------
• OI is not trading volume. Volume counts the total buying and selling done over a period (say 24 hours); OI counts how many positions remain open right now. If trader A sells an existing position to trader B, volume rises but OI doesn't change.
• OI only changes when positions are opened or closed. When a new position is opened (a new long and the short opposite it), OI rises. When a position is closed or liquidated, OI falls.
• OI doesn't tell you direction. Rising OI means fresh money has entered, but whether it's a fresh long or a fresh short can't be read from OI itself. This is its most important limitation, and most wrong interpretations come from here.
Why It Matters in Perpetual Futures?
------------------------------------------------
Perpetual markets run on leverage, and every leveraged position has a liquidation price. OI shows how many of those positions are sitting in the market at the same time. The higher OI is relative to the size of the market, the larger the chain of liquidations can be if price moves the wrong way for one side.
You can think of OI as the fuel, with the heatmap showing where that fuel has accumulated. When OI is rising, more fuel is being stored. When OI drops sharply, excess leverage is being drained.
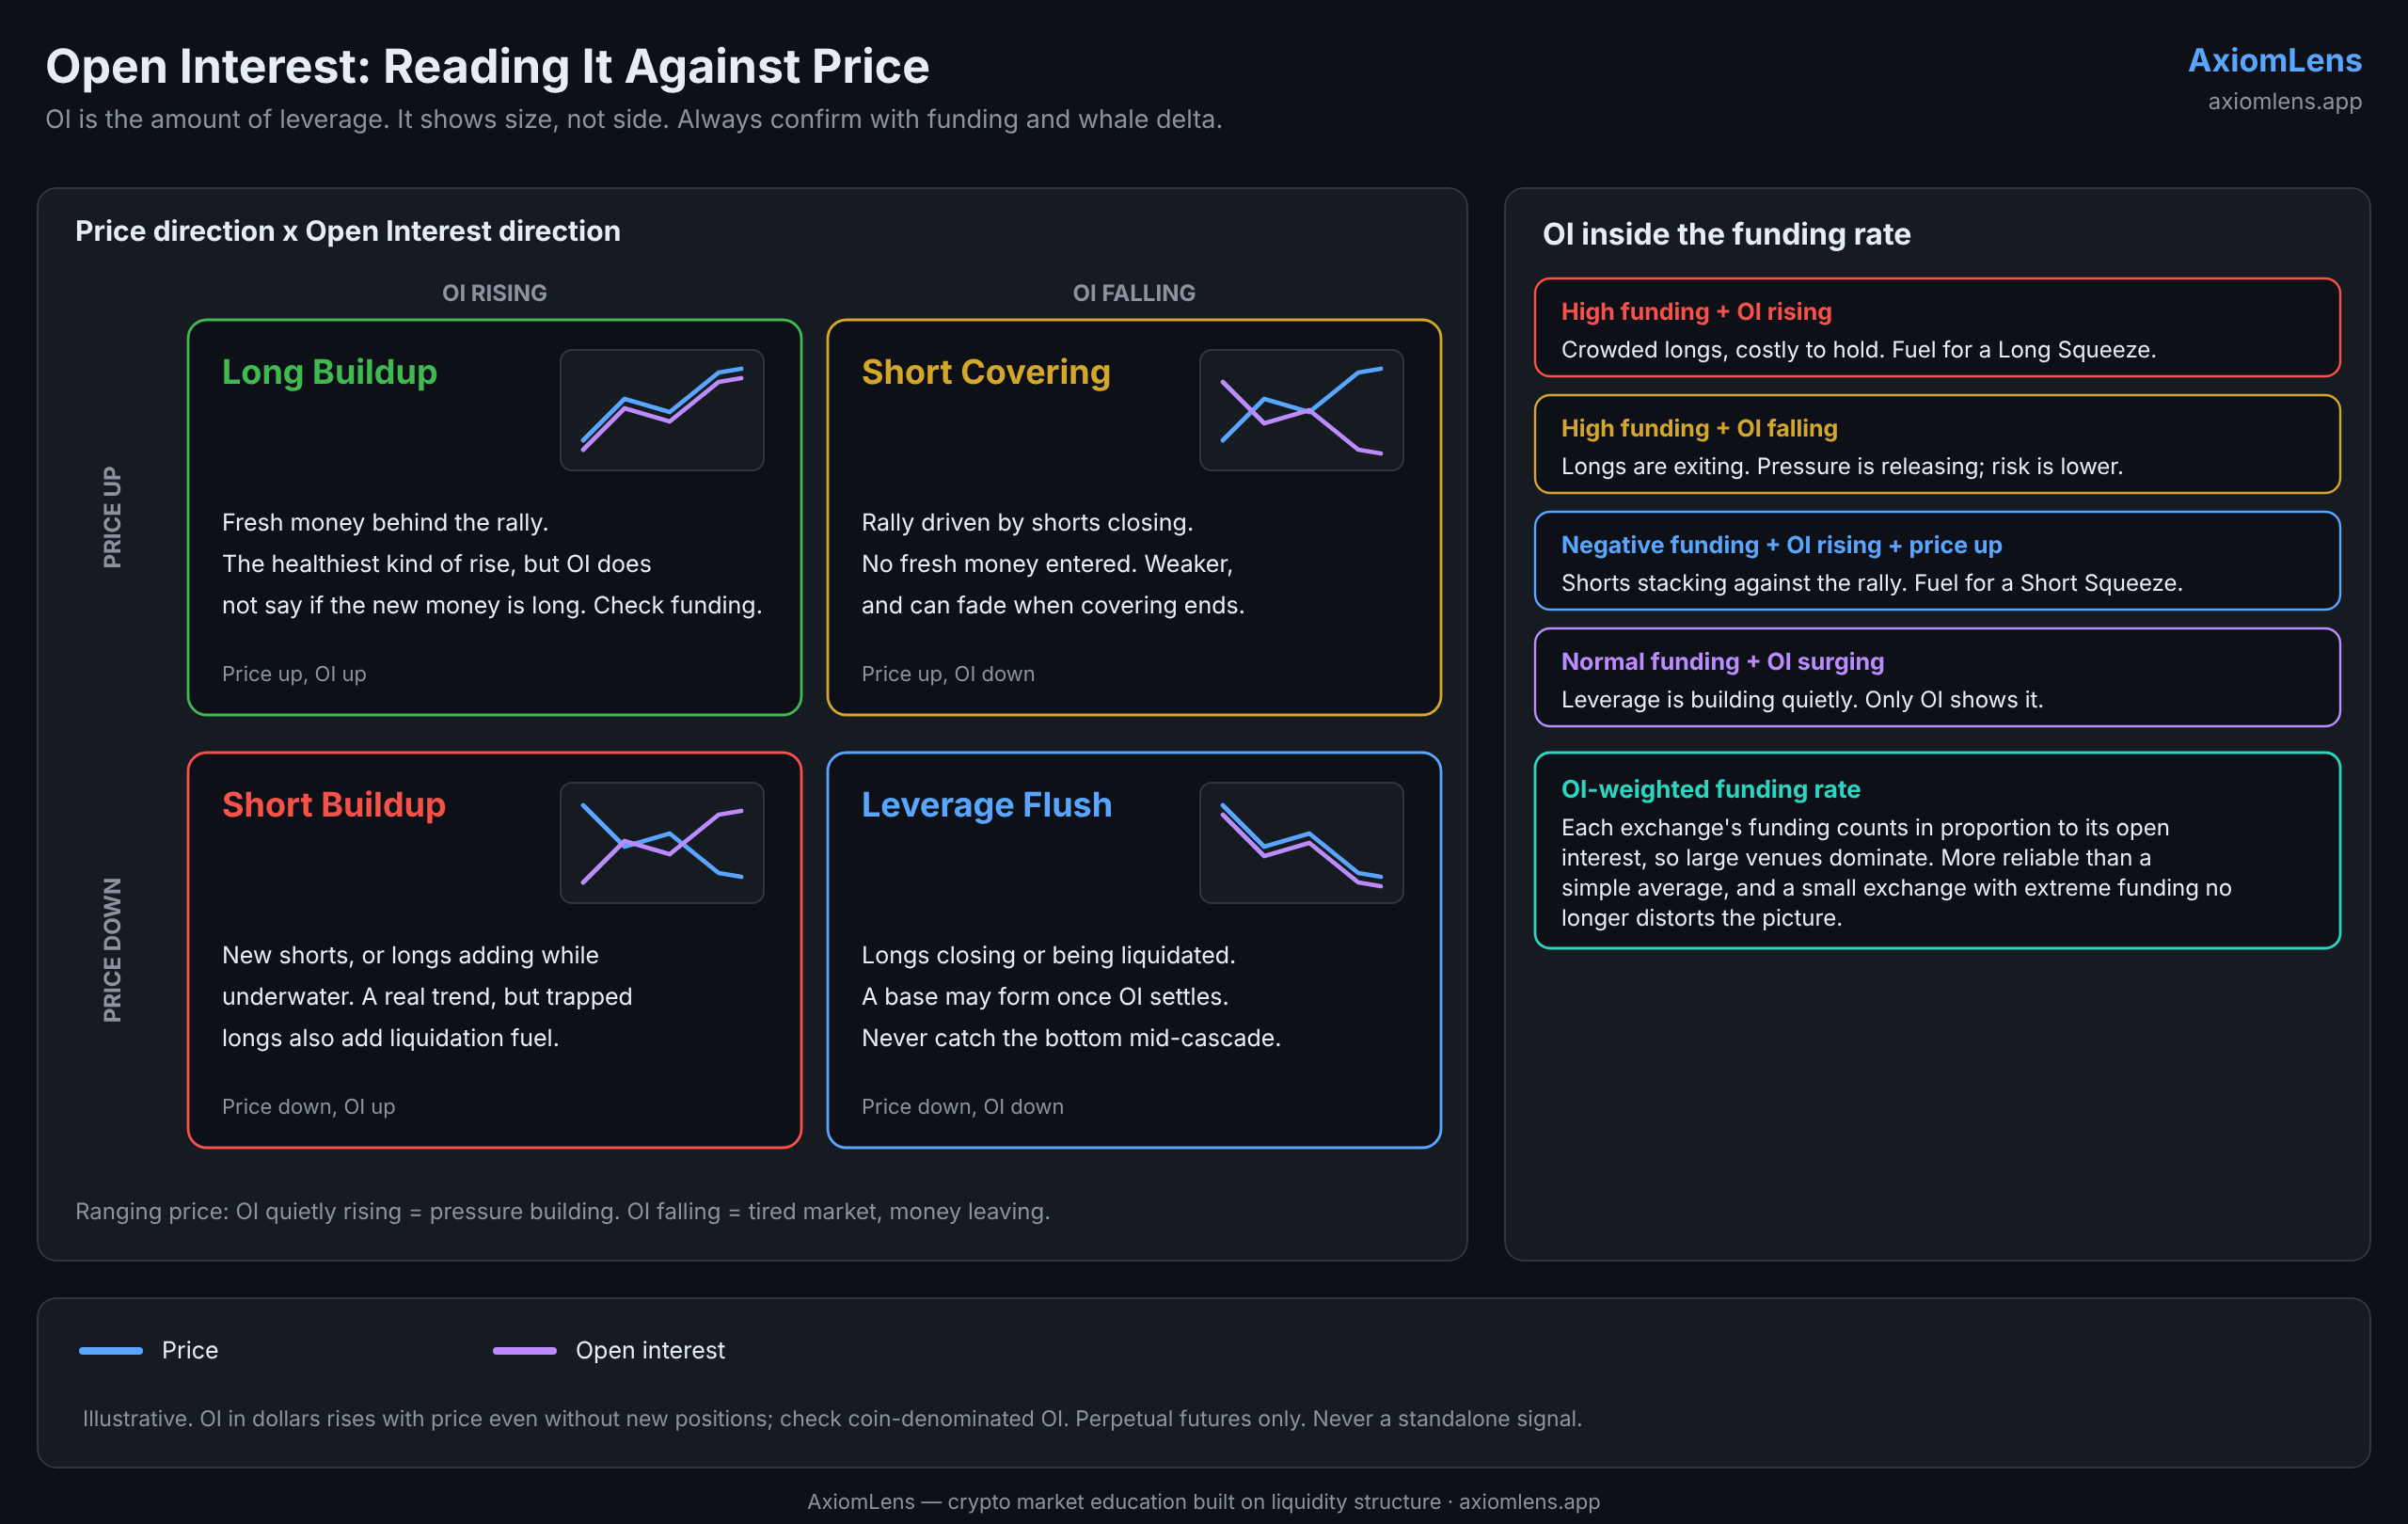
OI Direction Against Price: Four Main States
----------------------------------------------------------
Price Up + OI Up
Common reading: Fresh money behind the rally (Long Buildup). The healthiest form of a rise.
Caution: OI doesn't say whether the new money is longs, or shorts opened against the rally. Check funding and delta. If both are overheated, the market is crowded.
Price Up + OI Down
Common reading: A rally driven by shorts closing (Short Covering). No fresh money entered.
Caution: Usually weaker, and can fade once the covering is done.
Price Down + OI Up
Common reading: New shorts are being opened (Short Buildup), or longs are adding while underwater.
Caution: A decline with structural backing, but if many longs are trapped, liquidation fuel is stacking up as well.
Price Down + OI Down
Common reading: Longs are closing or being liquidated (a leverage flush).
Caution: After a sharp OI drop settles, a base may form. Don't try to catch the bottom in the middle of a cascade.
Two helper states: price ranging + OI quietly rising means money is waiting and pressure is building for a directional move (whichever way it breaks, it will be strong). Price ranging + OI falling means the market is tired and money is leaving.
OI and Price Divergence
--------------------------------
The most useful signals often come from disagreement:
• Price makes a new high but OI doesn't: a rally without fresh money, which makes it fragile. (Bearish OI divergence)
• OI reaches a record while price goes nowhere: many positions are stacked in a tight range. A break either way can create large liquidations.
• Price makes a new low and OI collapses: the leverage flush may be nearing its end; but entry still needs OI to stabilize and price structure to confirm.
Speed and Size of the Change
-----------------------------------------
A slow, steady rise in OI usually accompanies healthy growth. A sudden jump in OI, even in the "right" direction, means leverage is piling up faster than the market can absorb it, and the risk of sharp volatility rises. Also, rising OI when price is already at its highs does not carry the same message as rising OI at the start of a move.
The Role of OI in Interpreting Funding Rate
---------------------------------------------------------
Funding rate shows the price of leverage: how much one side pays to hold its position. Open interest shows the amount of leverage. Reading funding without OI is like seeing the price of a commodity without knowing the quantity. A few key combinations:
• High funding + OI rising: longs are getting more crowded, and holding them is expensive. This is fuel for a Long Squeeze.
• High funding + OI falling: longs are exiting and pressure is being released. The warning still applies, but risk is lower than in the previous case.
• Negative funding + OI rising + price rising: shorts are stacking up against the rally. This is fuel for a Short Squeeze.
• Normal funding + OI surging: funding still shows nothing, but leverage is quietly accumulating. You can only see this state by looking at OI.
OI-Weighted Funding Rate
-----------------------------------
Funding differs on every exchange. A simple average of exchanges gives a small exchange with extreme funding the same weight as a large one. In the OI-weighted funding rate, each exchange's funding enters the average in proportion to its open interest. The result sits closer to where real positions actually are. For that reason, to read "market-wide funding," this version is usually more reliable than a simple average. If one exchange's funding differs sharply from the OI-weighted figure, that exchange probably holds a small share of the market and its reading shouldn't be generalized.
What It Means for a Swing Trader?
----------------------------------------------
• Read OI together with price, on the 4H and daily timeframes, not off a single candle.
• Never draw a directional conclusion from rising OI alone. Test it against funding (preferably OI-weighted) and whale delta.
• Rising OI near a critical zone (close to a liquidation cluster on the heatmap) means the market is more primed for a sharp move; use a smart stop and smaller size.
• After a sharp OI drop, wait for it to stabilize and for 4H confirmation of price structure.
Limitations
--------------
If you look only at dollar OI, a rising price can lift it without a single new position being opened; always put the coin view next to it. Aggregated OI across all exchanges also differs from a single exchange's OI, and this article covers perpetual futures OI only, not options. Finally, OI doesn't reveal position direction; nothing in this article is a prediction, it is all input for judgment.
Takeaway
-------------
• OI is the total size of open positions (in dollars or coins), not trading volume, and it doesn't say direction. To spot fresh money, check both views.
• Price up + OI up is fresh money; price up + OI down is mostly short covering.
• Price down + OI up is fresh shorts or trapped longs; price down + OI down is a leverage flush.
• Disagreement between OI and price matters more than either direction on its own.
• OI is the amount of leverage and funding is its price; funding without OI is incomplete, and the OI-weighted version gives a better picture of the whole market.
After reading this article, you may feel that interpreting OI correctly means watching several other indicators at once, and worry about making mistakes in your analysis. Don't worry: AxiomLens is designed for exactly this. It analyzes OI simultaneously alongside the liquidation heatmap, funding rate, whale delta and the other effective indicators, and builds scenarios and decisions from how those signals align or conflict. You can lean on that multi-layered analysis to decide with more confidence.
O. H.
Founder, AxiomLens
🌐 axiomlens.app
________________________________________
This article is part of the AxiomLens educational series and is for education only, not financial advice. Crypto market analysis built on liquidity structure and capital flow, not prediction.