CVD: The Footprint of Aggression and How to Read It Against Price
Price shows the outcome. CVD helps reveal which side initiated more of the trading. Did buyers hit the order book with market orders, or did price rise simply because no seller stood in the way? The answer lives in CVD.
In the earlier articles, the heatmap showed where liquidity sits, funding rate showed how far the market is one-sided, whale delta showed what the largest players are doing, and open interest showed how much is open. CVD shows which side the aggression is coming from. This article covers the concept, the relationship with price and open interest, aggregated vs spot vs futures CVD, common mistakes, and its role in positioning.
What CVD Actually Is?
Every trade has two sides, but only one side initiates it: the one that uses a market order to hit a resting order in the book. We call it the aggressor (taker). The other side, who placed a limit order and waited, is passive (maker).
Volume delta over a period is aggressive buy volume minus aggressive sell volume. CVD (Cumulative Volume Delta) is the running total of those deltas. A rising CVD means aggressive buyers dominate; a falling CVD means aggressive sellers do.
Two points to be clear on from the start:
• CVD is not "buyers versus sellers." Every trade has both a buyer and a seller. CVD only says which side initiated.
• The absolute level of CVD means nothing. In most tools the starting point depends on the selected period. What matters is the slope and its relationship with price, not the number on the axis.
The most common way to display CVD is as CVD candles: the same CVD drawn as candles; each candle body shows where CVD started and where it ended in that period (green means it rose, red means it fell). This article uses that view as its basis, and for a swing trader (1 to 20 days) it is usually enough on the 4H and daily timeframes.
CVD and Price: Trend and Divergence
The most important use of CVD is comparing it with price:
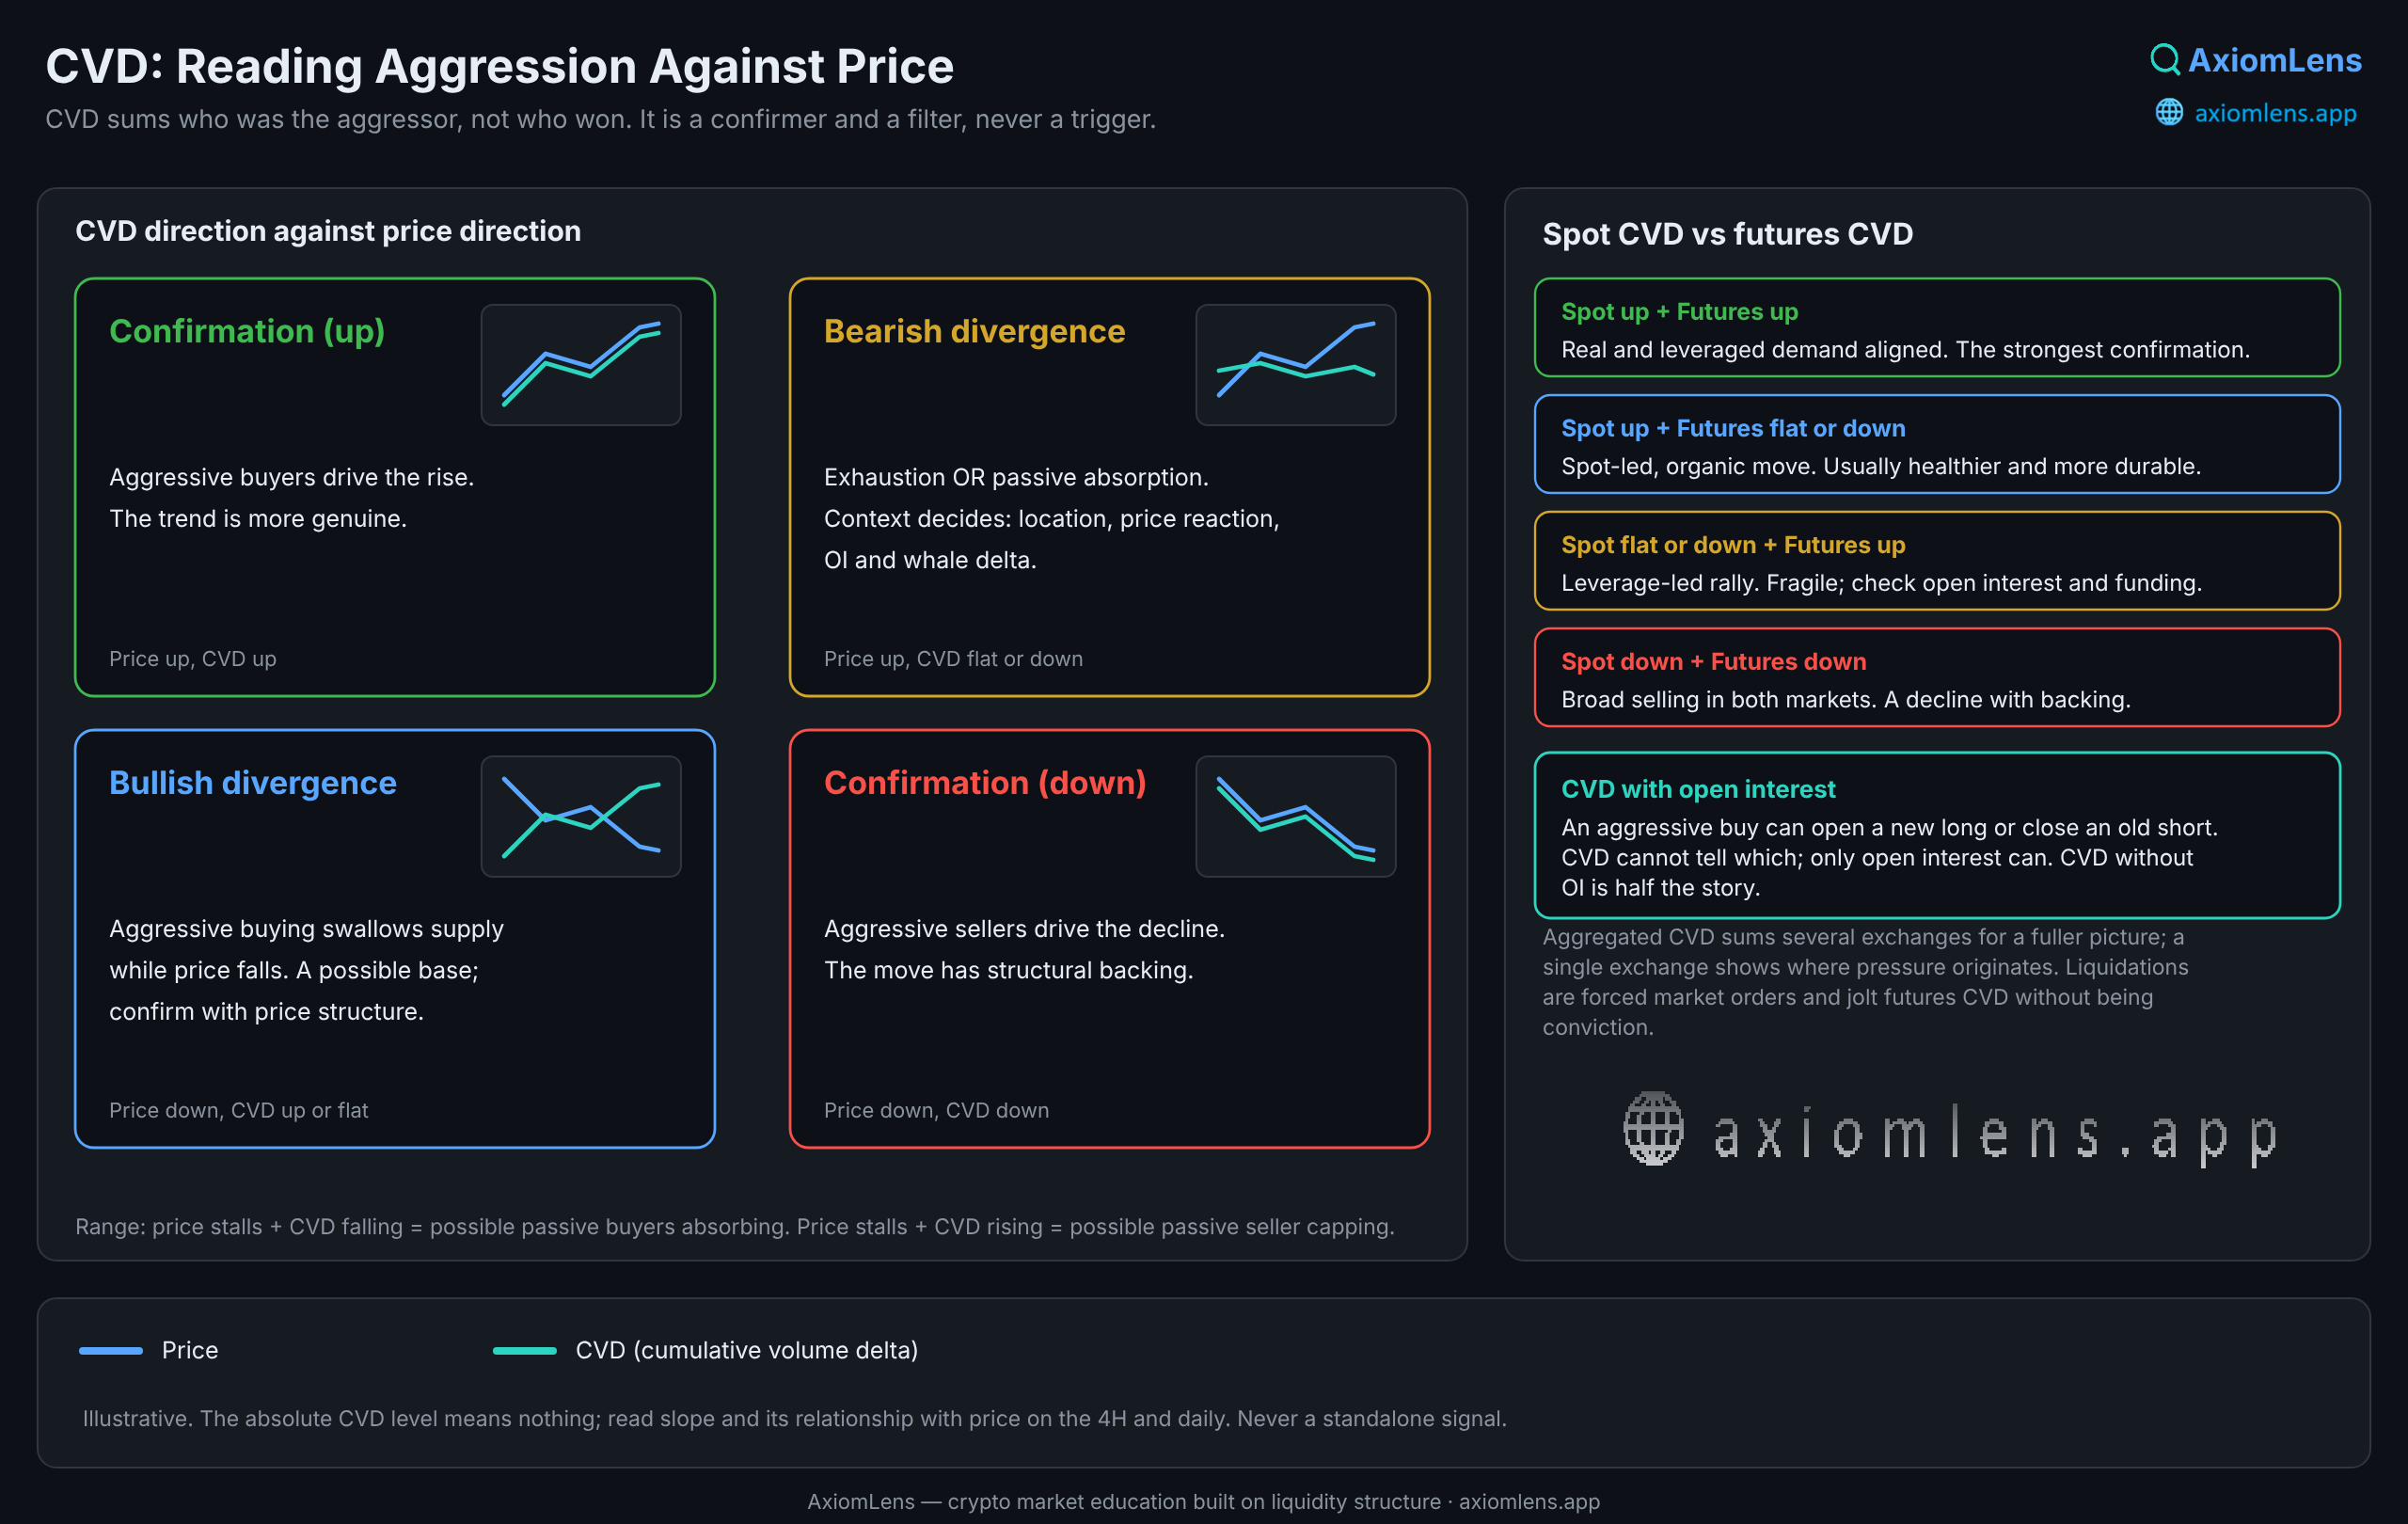
• Price UP + CVD UP: Confirmation. Aggressive buyers are driving the rise. The trend is more genuine.
• Price UP + CVD DOWN or FLAT: Bearish divergence. A rise without aggressive buying. Two readings are possible: buyer exhaustion (a listless, fragile rise), or passive absorption (hidden limit buyers swallow aggressive selling and price doesn't fall; an indirect bullish sign). Context decides.
• Price DOWN + CVD DOWN: Confirmation. Aggressive sellers are driving the decline.
• Price DOWN + CVD UP or FLAT: Bullish divergence. Selling pressure may be getting absorbed. A possible base, pending structural confirmation.
Here is how to understand absorption: CVD only sees the aggressor side. Passive buying with limit orders is invisible in CVD; its possible footprint is that price doesn't fall despite aggressive selling. The same logic applies in a range. Price stalls while CVD falls, and passive buyers may be absorbing. Price stalls while CVD rises, and a passive seller may be capping the rise. Keep in mind that divergence alone doesn't prove absorption: weak participation, differences between data sources or the way CVD is calculated can also create it.
How do you tell the bearish divergence apart? Without context the pattern is ambiguous. A few clues help:
• Where price is: a new high after a long rise, with hot OI and funding, looks more like exhaustion. Support or a range, with neutral or negative funding, looks more like absorption.
• How price reacts: if price keeps making higher lows despite falling CVD, absorption is more likely. If price structure breaks, exhaustion is confirmed.
• Open interest and whale delta: they confirm or reject who is behind the scenes.
A complementary note: short covering pushes CVD up when shorts are closed with aggressive buy orders, so it is not a good explanation for flat or falling CVD. CVD alone cannot tell it apart from fresh aggressive buying; open interest and liquidation data help narrow it down.
In breakouts: a break of a level with CVD moving the same way is more credible; a break that CVD doesn't confirm is suspect. A sharp CVD spike followed by a reversal can accompany a liquidity sweep, though it doesn't prove a stop hunt occurred.
CVD and Open Interest
Open interest shows that the number of open positions changed, but not whether the new positions are long or short. CVD adds information about the aggressive side, though it cannot tell whether those trades opened new longs, opened new shorts or closed existing positions. Combined:
• Price UP + CVD UP + OI UP: Aggressive buying while open positions grow: new positions are being created and buyers are the aggressive side. Constructive, but the data alone can't prove those buyers are opening longs.
• Price UP + CVD UP + OI DOWN: Aggressive buying while positions close: possibly short covering. Usually a weaker rise.
• Price DOWN + CVD DOWN + OI UP: Aggressive selling while open positions grow: a decline with more participation, though the data alone can't prove those sellers are opening shorts.
• Price DOWN + CVD DOWN + OI DOWN: Positions closing while sellers are aggressive: longs closing or being liquidated, a possible leverage flush.
• Price RANGE + CVD UP + OI UP: Aggressive buying and growing positions, but price isn't moving: a passive seller may be absorbing and pressure may be building.
A Practical Example: Is the Breakout Convincing?
Imagine Bitcoin breaks above a resistance level.
Case A: price rises, spot CVD rises and open interest increases. Aggressive buying is present in the spot market and open positions are growing. This is constructive, but it doesn't prove every aggressive buyer is opening a long. Check that price holds above the broken level and that futures activity agrees.
Case B: price rises, spot CVD falls and futures CVD rises. Futures traders are the more aggressive buyers while spot aggression goes the other way. This may point to a leverage-led move, but it isn't automatically bearish. Check funding, open interest, liquidity and whether price can hold the breakout.
The lesson: CVD doesn't predict the next move. It helps you test whether trading aggression is consistent with what price is doing.
Aggregated CVD
A single exchange's CVD sees only that exchange. Aggregated CVD sums aggression across several exchanges (and often several pairs) to give a picture of the whole market. Its strength is broad coverage. A few cautions:
• Aggregated CVD is not computed identically in every tool: the exchanges, pairs, market types, volume units and the method for detecting the aggressor side can all differ.
• Mixing different contract types (for example USDT-margined and coin-margined) and units (coins, contracts, dollars) must be properly standardized.
• Volume reported by some exchanges is not reliable and can distort the chart.
• To see the origin of the pressure, look at single-exchange CVD alongside it. If pressure comes from one exchange and the others don't follow, that is information in itself.
Spot CVD, Futures CVD and How They Relate
Spot is unleveraged trading: real buying and selling of the asset. Futures is leveraged, speculative trading, and also includes hedging and liquidations (a liquidation is a forced market order and moves futures CVD directly). Futures volume is usually many times spot, so compare direction and agreement, not absolute size.
• Spot CVD UP + Futures CVD FLAT or DOWN: Spot-led move. Often a stronger confirmation, though it doesn't guarantee durability.
• Spot CVD FLAT or DOWN + Futures CVD UP: Leverage-led move. Can be more fragile; check open interest and funding.
• Spot CVD UP + Futures CVD UP: Aligned. Stronger directional confirmation, especially when price structure agrees.
• Spot CVD DOWN + Futures CVD UP: Leveraged traders are going long while spot holders sell. A bearish warning.
• Spot CVD DOWN + Futures CVD DOWN: Aligned bearish. Real and leveraged selling pressure.
One note: futures liquidations don't directly make spot CVD vertical; their effect reaches spot only mildly, through arbitrage.
Common Mistakes
1. Reading the absolute CVD level. The starting point is arbitrary. Read slope and divergence.
2. Interpreting CVD as "more buyers than sellers." CVD only counts the initiator.
3. Deciding on CVD alone. CVD without price, OI and liquidity is incomplete.
4. Ignoring the spot versus futures difference. They are different things, and their combination carries information.
5. Trusting small timeframes for swing trading. At 1 to 5 minutes, noise dominates.
6. Treating divergence as a trigger. Divergence is a condition, not a timing signal; it can persist for a long time.
7. Confusing CVD with whale delta. CVD counts the aggression of all traders; whale delta tries to isolate large trades, depending on its data source and definition. A conflict between them is a useful clue, but not proof of what "smart money" is doing.
8. Ignoring liquidation spikes. A liquidation cascade can jolt futures CVD in ways unrelated to the market's real intent.
CVD's Role in Positioning
For a swing trader, CVD is more of a quality filter than an entry trigger:
• Before a long at support: is CVD not making new lows (selling pressure running out), and is spot CVD aligned?
• On breakouts: does CVD confirm the break? Treat a break without CVD with suspicion.
• Near highs: bearish CVD divergence together with open interest is a case for reducing size or scaling out.
• Sizing: when CVD, OI, funding and whale delta agree, confidence is higher. When they conflict, cut size or wait.
The Fewest Indicators, the Most Confidence
There are many indicators in the derivatives market, and each affects analysis from one angle: the heatmap, funding, open interest, whale delta, CVD and many more. But the real challenge isn't having all of them. Reaching an acceptable level of reliability for decision-making quickly, through the smart use of the fewest indicators, is both knowledge and an art. In line with its stated mission and vision, AxiomLens has tried to reach exactly this point and put it in the hands of the independent analyst: it analyzes CVD simultaneously alongside the heatmap, funding, open interest and whale delta, and builds scenarios and decisions from how they align or conflict. See it at axiomlens.app.
Takeaway
• CVD is the running total of aggressive buying minus aggressive selling; the absolute level doesn't matter, slope and divergence do.
• Price and CVD moving together is confirmation; moving apart is divergence and absorption.
• With open interest you see whether positions are growing or closing, and CVD adds which side was aggressive; neither proves who is long or short.
• Aggregated CVD shows the whole market; single-exchange CVD shows where pressure originates.
• Spot-led is often a stronger confirmation than leverage-led; alignment of both is stronger still.
• CVD is a quality filter, not an entry trigger.
O. H.
Founder, AxiomLens
🌐 axiomlens.app
________________________________________
This article is part of the AxiomLens educational series and is for education only, not financial advice. Crypto market analysis built on liquidity structure and capital flow, not prediction.