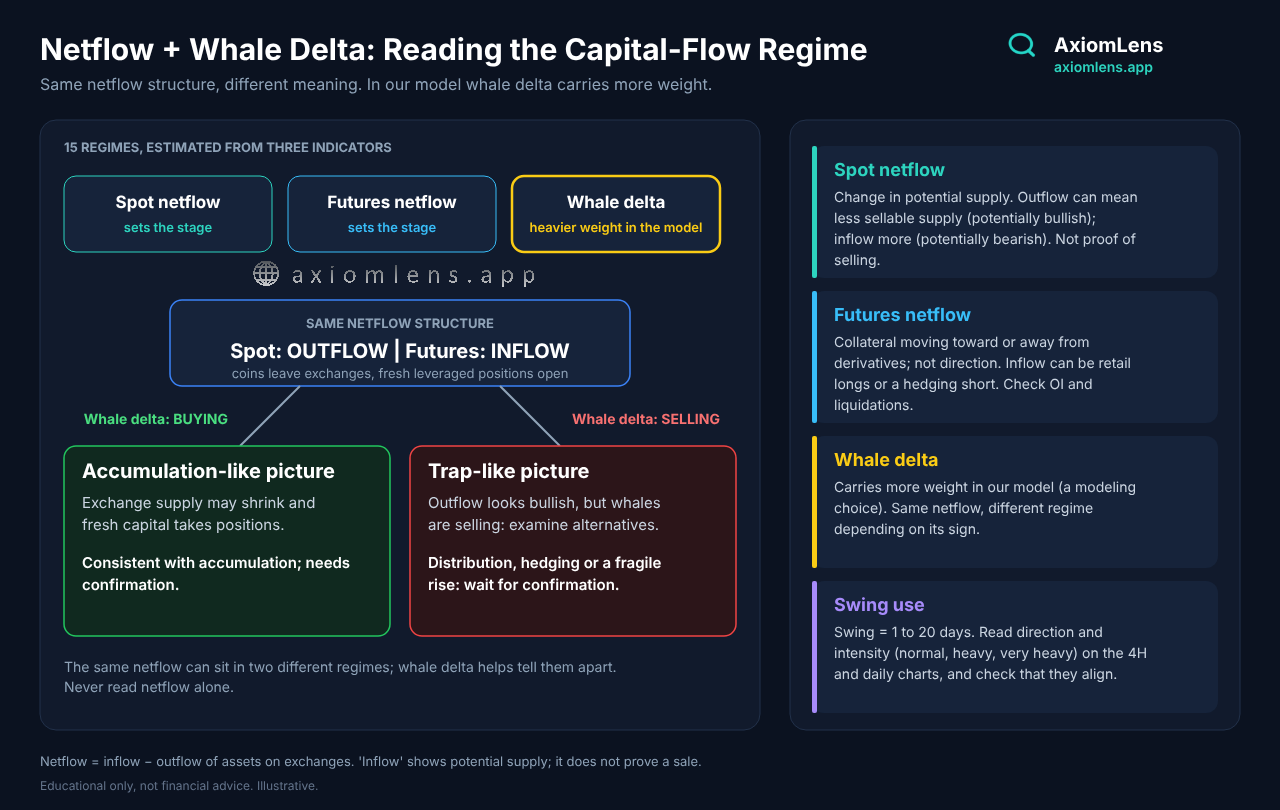
Spot and Futures Netflow: Where Is the Money Going, and What Are the Whales Saying?
Price is the last chapter of a story. Before price moves, money moves: an asset arrives at an exchange where it may be sold, or leaves an exchange to be held; capital flows into the derivatives market to build leverage, or flows out as leverage is reduced. The indicator that counts these movements is Netflow.
On its own, though, netflow is ambiguous. A net inflow can be sell pressure, or it can be collateral for a long trade. That is why AxiomLens never reads spot and futures netflow alone; it places them next to whale delta to estimate the capital-flow regime and liquidity behavior. This article explains what netflow is, what role each of its two types plays, why whale delta carries more weight in our model, and how a swing trader can use them.
What Netflow Actually Is?
• Inflow: assets moving onto exchanges.
• Outflow: assets moving off exchanges.
• Netflow = Inflow − Outflow. Positive means net inflow; negative means net outflow.
These figures are usually estimated from on-chain data and identified exchange addresses. In the AxiomLens framework:
• Net outflow can reduce the potentially sellable supply on exchanges: a potentially bullish backdrop.
• Net inflow can increase the potentially sellable supply on exchanges: a potentially bearish backdrop.
The word "potentially" matters. An asset that arrives at an exchange may never be sold: it can be collateral, it can be there for a leveraged trade, or it can be an internal transfer. An inflow does not prove a sale.
Spot Netflow
On-chain spot netflow shows the net movement of assets into and out of identified exchange wallets. It is slow, and it is useful for judging changes in potentially sellable supply, but on its own it does not prove selling, accumulation or price direction: it sees only the flows of identified addresses, not the market's entire supply.
A note on stablecoins: a net stablecoin inflow to an exchange can signal rising potential buying power, and an outflow may reduce that capacity. But stablecoins may also arrive as derivatives collateral, for arbitrage, or for transfers between accounts; so check the type of exchange, the likely use of the funds and the other indicators as well.
Futures Netflow
In the AxiomLens framework, we read futures netflow as a signal of capital (collateral) moving toward or away from the derivatives market.
• Inflow: can signal readiness for leveraged positioning.
• Outflow: can accompany deleveraging, or even forced liquidation.
These are signals, not proof. A fund transfer alone does not say that a position was opened or closed; read open interest and liquidations alongside it. And more importantly: futures netflow does not tell you direction. A futures inflow can be retail longs or a hedging short against spot holdings. Direction has to come from elsewhere.
A warning about definitions and data sources: some data providers have an indicator named "NetFlow" that is not asset transfer at all but the difference between aggressive buy and aggressive sell volume (Taker Buy − Taker Sell). That is a trading flow and is computationally related to the change in CVD over the same window; its sign and meaning differ from transfer-based netflow. Before using a source, check exactly what it measures.
How Is Netflow Different from CVD?
The two indicators answer different questions:
• Transfer-based netflow: are assets entering or leaving exchanges? (asset movement)
• CVD: in executed trades, was aggressive buying or aggressive selling larger? (buy/sell pressure)
A numeric example: suppose that over some interval 1,500 BTC flowed onto exchanges and 1,200 BTC flowed off; netflow is +300. In the same interval aggressive buying was 900 BTC and aggressive selling 600 BTC; delta is also +300. The numbers happen to match, but they are different quantities, and one is not computed from the other.
Here is the subtle point: if an indicator named NetFlow is defined as the difference between aggressive buying and selling, that difference over each window equals the change in CVD over the same window (provided the market, unit and aggregation method are the same). So check the source's definition before comparing. Read the details of CVD in its own article.
Whale Delta: Why Does It Carry More Weight?
AxiomLens has identified 15 capital-flow regimes and liquidity behaviors. To estimate the dominant regime, AxiomLens has two methods: one based on net inflow and outflow of assets on exchanges (netflow) and one based on net Taker flow (the difference between aggressive buying and aggressive selling). Each method has its own interpretation logic, and whale delta is shared by both. In this article we emphasize the netflow method, but AxiomLens supports both. In the netflow method it reads three indicators together: spot netflow, futures netflow and whale delta. As we noted in the Whale Delta article, in our model whale delta carries more weight than the two netflows: the two netflows set the stage and whale delta plays the larger part in choosing the regime. The reason is that it is a more direct trace of what large players are doing.
This weighting is a modeling choice, not a general law of the market; a large player is not always right, and may be hedging or running arbitrage. Whale delta alone does not determine future price behavior either.
Same Netflow, Different Meaning
One netflow combination can appear in two very different regimes, and whale delta usually helps tell them apart. For example, coins leaving exchanges while fresh capital flows into futures: if whales are buying at the same time, the combination is consistent with an accumulation hypothesis. If they are selling, alternative scenarios (distribution, hedging, or a rise that does not last) should be examined. These data alone do not prove the intent of any player. The conclusion: netflow alone can lead you to misread the regime.
Regime First, Scenario Second
This article is part of a larger order of analysis described in Reading the Market with Precision: How Order Flow Scenarios and Capital Flow Regimes Work Together: first estimate the capital-flow regime (the netflows and whale delta), then look for the order-flow scenario that matches it. A bullish order-flow scenario in a regime that agrees with it is a stronger signal; the same scenario in the opposing regime is more likely a trap.
A Practical Guide for the Swing Trader
At AxiomLens, swing trading means holding a position for 1 to 20 days. For that reason we evaluate netflow and whale delta on two timeframes, 4H and daily, and record them in the application: the 4H shows fresh changes and timing, while the daily shows the more durable picture.
Record intensity, not the raw number. Each inflow or outflow falls into one of three levels: normal, heavy or very heavy. The level is recorded in two ways:
• By the trader: based on their own knowledge of the market and the sources available (charts, indicators or an API).
• By AxiomLens's estimate: based on available Binance exchange data. The daily or 4H value is compared against the 30-day standard deviation; the further the value is from the typical behavior of the past 30 days, the heavier it is recorded.
The estimate rests on a single exchange's data and is not a picture of the whole market; for assets where you have a better source, a manual entry may be more accurate.
Four steps:
1. Read both timeframes: for spot and futures, inflow or outflow and its intensity (normal, heavy, very heavy).
2. Check alignment between the two timeframes. If 4H and daily point the same way and are heavy, the signal is more dependable. If they conflict, either a fresh change is forming on the 4H that the daily has not yet confirmed, or the reverse; be cautious.
3. Read whale delta on the same two timeframes; in our model it carries the heavier weight.
4. Estimate the dominant regime, match it against the order-flow scenario, and decide with a smart stop. If the indicators conflict, reduce size or wait.
"Normal" intensity means the flow is within its usual 30-day range and usually adds no new information; the focus is on heavy and very heavy. These ranges and methods are AxiomLens's operating framework, not a general law; data behaves differently across assets and periods.
Where to Get the Data?
These data can't be seen on a price chart; you have to take them from data providers' indicators and charts (free charts, paid indicators, or an API). But providers sometimes offer indicators with similar names and different definitions, so separate three groups of data:
1. On-chain exchange netflow: asset inflows to and outflows from identified exchange addresses, and the change in their balances. This is what this article means by "netflow."
2. Trading flow: aggressive buying, aggressive selling, their difference and CVD. These concern executed trades, not asset transfers.
3. Derivatives positioning indicators: open interest, funding, long/short ratios and liquidations. They are useful for understanding open contracts and market imbalance, but none of them guarantees future direction.
Coverage is not the same for every coin across sources; if there is no reliable source for a coin, analyze it without this layer, using whale delta, OI and CVD.
Practical tips for whichever source you choose:
1. Read the change, not the level. An absolute balance or flow number says nothing; its direction and intensity relative to normal behavior (for example the past 30 days), on the 4H and daily timeframes, matter.
2. Look at repetition too. Heavy intensity that repeats over several 4H candles or days is more dependable than a single observation.
3. If possible, look at the exchange breakdown. If the whole change comes from one exchange, an internal transfer or a change in data coverage is more likely; verify this against that exchange's own data.
4. Compare with price and whale delta, and estimate the dominant regime.
5. Check each source's definition and sign before you use it.
Common Mistakes
• Reading only one timeframe. Read 4H and daily together; heavy intensity on one timeframe, without alignment from the other and from whale delta, is still not the full picture.
• Inflow = certain selling. Inflow only raises potential supply.
• Reading the balance level instead of its change. The absolute exchange balance says nothing; the change over the window does.
• Futures inflow = longs, or futures outflow = positions closed. A fund transfer does not prove direction or that a position was closed; read OI and liquidations alongside it.
• Deciding on netflow alone. Read netflow next to whale delta and the other indicators.
• Incomplete exchange coverage. Netflow only sees exchanges and addresses that have been identified.
Many Indicators, One Craft
There are many indicators, and each affects analysis from one angle: netflow, whale delta, CVD, open interest, funding, the heatmap. But the real challenge for the independent trader is not a shortage of indicators; it is the abundance. The knowledge and the art is to reach an acceptable level of reliability for decision-making quickly, through the smart use of the fewest indicators. In line with its stated mission and vision, AxiomLens has tried to reach exactly this craft and put it in the hands of the independent analyst.
After reading this article, you may feel that interpreting netflow correctly means watching spot, futures, whale delta and several other indicators at once, and worry about making mistakes in your analysis. Don't worry: AxiomLens is designed for exactly this. It analyzes netflow simultaneously alongside whale delta, CVD, open interest, funding rate, the liquidation heatmap and the other effective indicators, and builds scenarios and decisions from how they align or conflict. You can lean on that multi-layered analysis to decide with more confidence. See it at axiomlens.app.
Takeaway
• Netflow = inflow − outflow of assets on exchanges; outflow is potentially bullish, inflow potentially bearish; neither proves buying or selling.
• Spot netflow shows changes in potential supply; futures netflow is a signal of collateral moving toward or away from derivatives and does not tell you direction.
• Transfer-based netflow differs from CVD; but a "NetFlow" defined as aggressive buy minus sell (net Taker) is computationally related to the change in CVD. Check the source's definition.
• AxiomLens has two methods for estimating the regime, exchange netflow and net Taker, and supports both; this article focuses on the netflow method.
• In AxiomLens's model whale delta carries more weight; this is a modeling choice, and one netflow combination can appear in two different regimes.
• For swing trading (1 to 20 days), read direction and intensity (normal, heavy, very heavy) on the 4H and daily timeframes and check their alignment.
• Keep three groups of data apart: on-chain netflow, trading flow, and derivatives positioning indicators.
O. H.
Founder, AxiomLens
🌐 axiomlens.app
________________________________________
This article is part of the AxiomLens educational series and is for education only, not financial advice. Crypto market analysis built on liquidity structure and capital flow, not prediction.