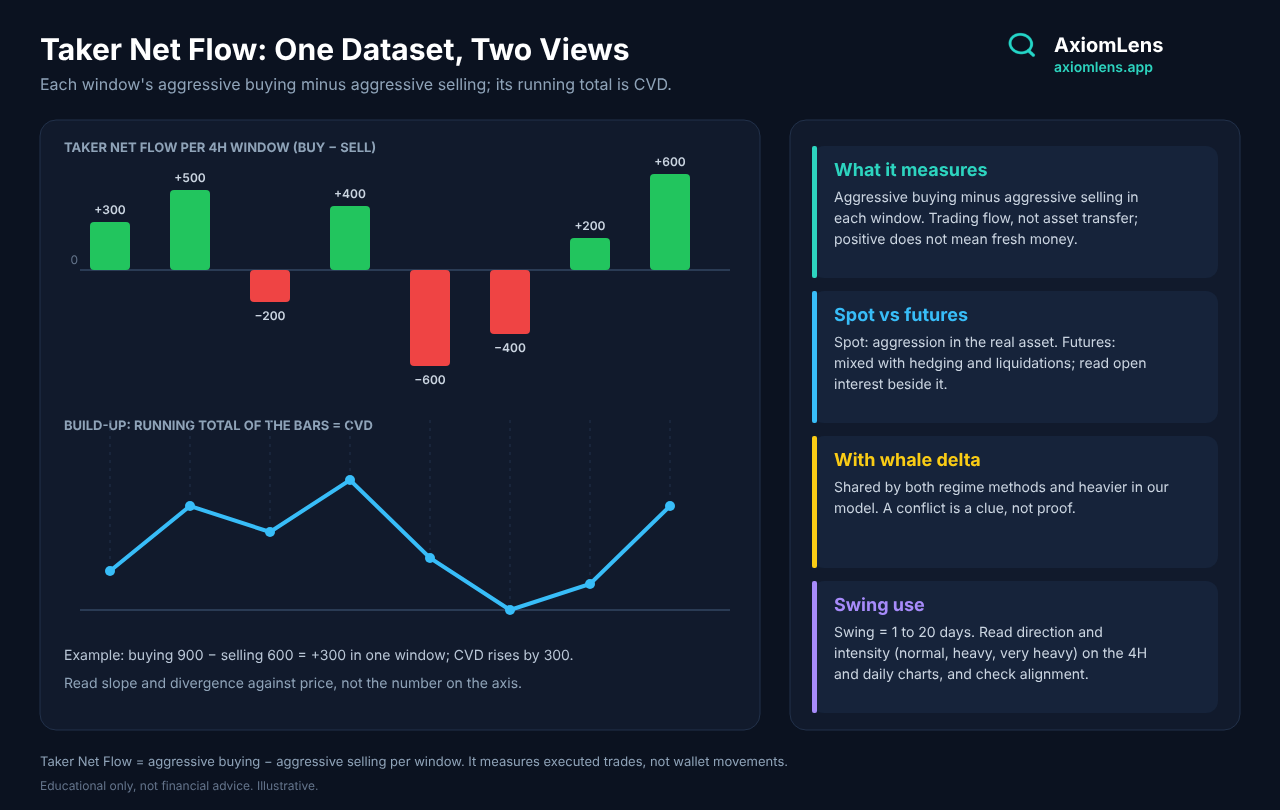
Taker Net Flow: What Aggressive Buying and Selling Say About the Market Regime
In the netflow article we saw that one way to understand money flow is to follow the movement of assets onto and off exchanges. The second way is to look at the trades themselves: in each window, which side hit the other side's resting orders? That is Taker Net Flow.
To estimate the capital-flow regime, AxiomLens supports both methods. This article focuses on the second: what Taker Net Flow is, how it relates to CVD, what its spot and futures versions say, why it is read next to whale delta, and how a swing trader can use it.
What Taker Net Flow Actually Is
In every trade only one side initiates: the taker, who uses a market order to hit a resting order. The other side, who placed a limit order and waited, is the maker.
Aggressive buying: takers who buy.
Aggressive selling: takers who sell.
Taker Net Flow = aggressive buying − aggressive selling over a window. Positive means buyers were more aggressive; negative means sellers were.
This indicator does not measure asset transfers onto exchanges; it concerns executed trades. So a positive reading does not mean "fresh money" entered. It only means aggressive buying dominated that window.
Taker Net Flow and CVD: One Dataset, Two Views
The relationship is simple:
Taker Net Flow is the delta of each window.
CVD is the running total of those deltas.
So each candle's Taker Net Flow equals the change in CVD over that candle (provided the market, unit and aggregation method are the same). Example: if aggressive buying in a 4H candle is 900 BTC and aggressive selling is 600 BTC, Taker Net Flow is +300 and CVD rises by 300 over that candle.
The difference is the angle: CVD shows trend and divergence against price, while Taker Net Flow shows the strength of each window. Read the details of CVD in its own article.
Spot and Futures Taker Net Flow
Spot: unleveraged trading. A positive spot reading means buyers of the actual asset were more aggressive in that window.
Futures: leveraged, speculative trading, including hedging and liquidations. Aggressive futures buying can be new longs opening, shorts closing, or even short liquidations, and Taker Net Flow alone cannot separate these. That is why you should read open interest, funding and liquidations beside it.
Futures volume is usually many times spot, so compare direction and agreement between the two markets, not absolute size. If spot and futures Taker Net Flow agree and are heavy, you have stronger confirmation. If they disagree, the picture is more complex and needs more context.
Why Next to Whale Delta?
Whale delta is shared by both regime-estimation methods, and in our model it carries more weight. Taker Net Flow counts the aggression of all traders, while whale delta, depending on its source and definition, tries to isolate large trades. Side by side they have three cases:
Same direction: general aggression and the larger players say the same thing; the picture is clearer.
General aggression positive, whales negative: retail is buying and the larger players are not; a reason for caution.
General aggression negative, whales positive: broad selling, but larger players may be absorbing; check price's reaction.
These conflicts are clues, not proof of anyone's intent.
From Taker Net Flow to Regime
AxiomLens has identified 15 capital-flow regimes and liquidity behaviors. In the Taker Net Flow method, the dominant regime is estimated from three indicators: spot Taker Net Flow, futures Taker Net Flow and whale delta. Each method has its own interpretation logic; as we noted in the netflow article, whale delta is shared by both.
One combination can appear in two different regimes. For example, dominant aggressive buying in futures with weak buying in spot: if whales are buying too, it may be the start of a real move; if they aren't, it may be a speculative and fragile one. These data alone do not prove anyone's intent, so test the regime against the order-flow scenario and price structure, in the order described in Reading the Market with Precision.
A Practical Guide for the Swing Trader
At AxiomLens, swing trading means holding a position for 1 to 20 days. For that reason we evaluate Taker Net Flow and whale delta on two timeframes, 4H and daily, and record them in the application.
Record intensity, not the raw number. Each value falls into one of three levels: normal, heavy or very heavy. The level is recorded in two ways:
By the trader: based on their own knowledge and the sources available.
By AxiomLens's estimate: based on available Binance exchange data; the daily or 4H value is compared against the 30-day standard deviation, and the further it is from the past 30 days' typical behavior, the heavier it is recorded.
The estimate rests on a single exchange's data and is not a picture of the whole market.
An example: is the breakout convincing? Imagine price breaks above a resistance level.
Case A: spot Taker Net Flow is positive and "heavy" on the 4H, positive on the daily too, and whale delta agrees. Aggressive buying shows up in two timeframes and in the real market. It is constructive; check that price holds above the broken level.
Case B: futures Taker Net Flow is "very heavy" and positive on the 4H, but spot is normal or negative and the daily is weak. This may be a leverage-led move, though not automatically bearish. Check open interest, funding and liquidity, and size cautiously.
Four steps:
Read both timeframes: for spot and futures, the direction and intensity of Taker Net Flow.
Check alignment between the two timeframes. Heavy on the 4H is recorded and matters; confidence rises when the daily points the same way.
Read whale delta on the same two timeframes.
Estimate the dominant regime, match it against the order-flow scenario, and decide with a smart stop. If the indicators conflict, reduce size or wait.
"Normal" intensity means the value is within its usual 30-day range and usually adds no new information. These methods and ranges are AxiomLens's operating framework, not a general law.
Where to Read Taker Net Flow
The page coinglass.com/inflow-outflow offers this same indicator. According to Coinglass's own explanation, Inflow/Outflow on that page means active buy minus active sell, not asset transfers to exchanges. The page is a table by symbol, with a choice between Futures and Spot and columns for windows from 5 minutes to 30 days.
For swing trading:
Read the 4-hour and 24-hour columns, and the weekly and 15-day columns for the broader context. The few-minute columns are noise for swing trading.
Check alignment between the 4H and 24H, and compare spot with futures.
In futures, confirm with open interest and liquidations; Coinglass itself warns that active buying can be opening longs or closing shorts.
Column names and layout may change; always check the definition and sign in the source itself.
Common Mistakes
Positive = fresh money. A positive Taker Net Flow only means aggressive buying dominated.
Reading only one timeframe. Read 4H and daily together.
Reading futures without open interest. You can't tell whether the aggression created or closed positions.
Ignoring liquidations. A liquidation cascade can jolt futures Taker Net Flow in ways unrelated to the market's real intent.
Comparing spot and futures size. Compare direction and agreement.
Deciding on Taker Net Flow alone. Read it next to whale delta, price and the other indicators.
The Fewest Indicators, the Most Confidence
There are many indicators, and each affects analysis from one angle: Taker Net Flow, netflow, whale delta, CVD, open interest, funding, the heatmap. The challenge for the independent trader is not a shortage of indicators but their abundance. The real craft is to reach an acceptable level of reliability for decision-making quickly, through the smart use of the fewest indicators. In line with its stated mission and vision, AxiomLens has tried to reach exactly this craft and put it in the hands of the independent analyst: it analyzes Taker Net Flow simultaneously alongside whale delta, CVD, open interest, funding and the heatmap, and builds scenarios and decisions from how they align or conflict. See it at axiomlens.app.
Takeaway
Taker Net Flow = aggressive buying − aggressive selling per window; it is trading flow, not asset transfer.
Each window's Taker Net Flow equals the change in CVD over that window; CVD is their running total.
Spot shows the real market's aggression; futures is mixed with hedging, liquidations and leveraged positions and needs open interest.
Whale delta is shared by both regime-estimation methods and carries more weight in our model; a conflict with Taker Net Flow is a clue, not proof.
For swing trading (1 to 20 days), read direction and intensity on the 4H and daily timeframes and check alignment.
AxiomLens has two methods for estimating the regime: exchange netflow and Taker Net Flow.
O. H.
Founder, AxiomLens
This article is part of the AxiomLens educational series and is for education only, not financial advice. Crypto market analysis built on liquidity structure and capital flow, not prediction.