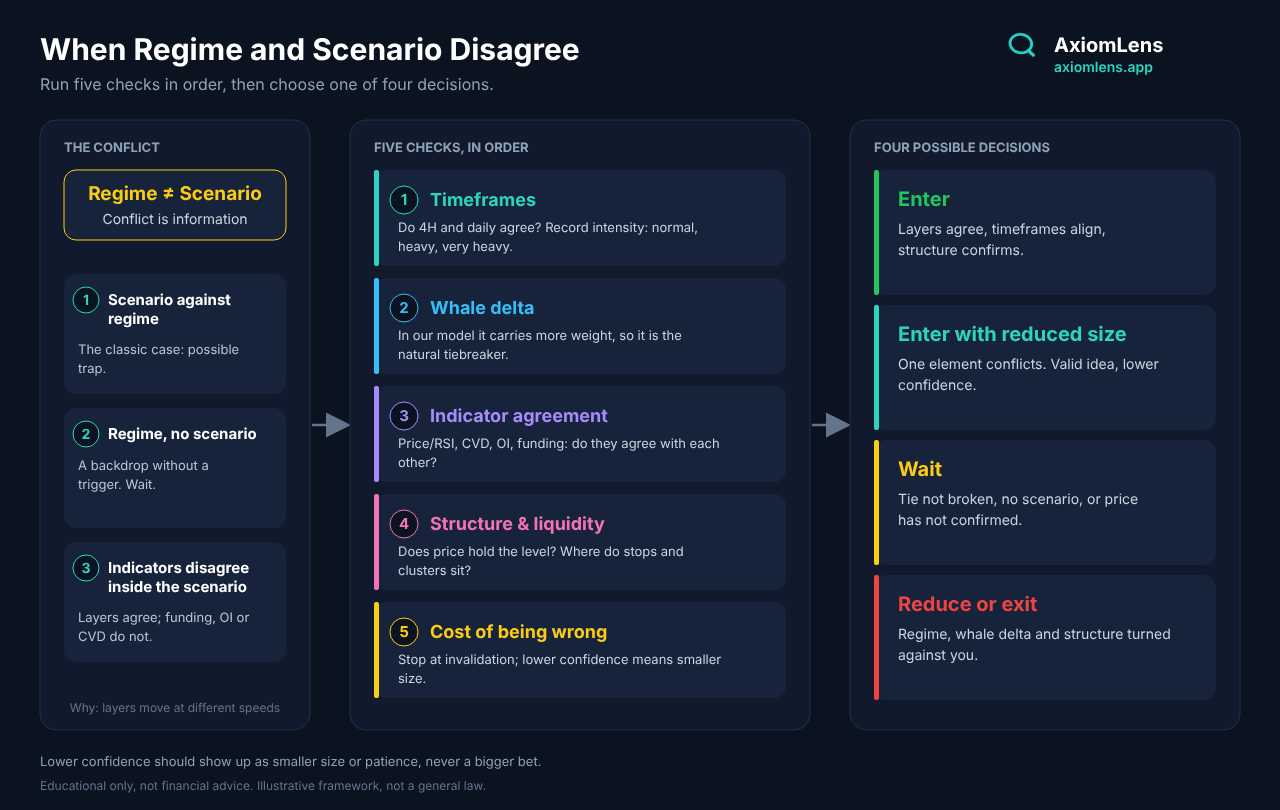
When Regime and Scenario Disagree: A Decision Checklist for Swing Traders
Sooner or later every analyst meets this moment: the capital-flow regime leans one way, while the order-flow scenario on the chart says the opposite, or says nothing at all. Many traders read this as a mistake in their analysis and either force a trade or throw the analysis away.
This article makes a different argument: disagreement between regime and scenario is normal, and it is information. It tells you the market is not speaking with one voice, and that is exactly when position size, patience and the stop matter most. Below we cover why the conflict happens, what its common forms are, and a five-step checklist for deciding what to do. This builds on the order described in Reading the Market with Precision: first the regime, then the scenario.
Two Layers, Two Questions
The regime asks: what is the mood of money and liquidity? It is estimated from capital-flow indicators (the netflow method or the Taker Net Flow method) together with whale delta, and it describes a backdrop that usually plays out over days.
The scenario asks: what pattern is price building right now? It is read from order flow and price behavior, and it is faster and more local.
Because the two layers move at different speeds and answer different questions, they are not always in step. A fresh pattern can form on the 4H chart before the slower backdrop has changed, and a backdrop can turn while the chart still shows an old pattern. A conflict often means one layer has not caught up with the other yet.
Three Kinds of Conflict
1. The scenario points one way, the regime the other. For example, a bullish scenario appears while the regime backdrop is unfavorable to buyers. This is the classic case. The same scenario that is a stronger signal inside a supportive regime is more likely to be a trap in an opposing one, though "more likely" is not "certain."
2. The regime is clear, but no scenario is active. The backdrop leans one way but price shows no matching pattern. This is not a conflict to resolve; it is a reason to wait. A backdrop without a trigger is context, not a trade.
3. Regime and scenario agree, but the indicators inside the scenario disagree. This one is not a conflict between the layers but a disagreement within one of them. Regime and scenario line up overall, yet some of the indicators that make up the scenario (for example funding rate, open interest, CVD or RSI) lean the other way: a constructive picture while funding is crowded and open interest is rising fast. The direction is consistent, but the quality of the setup is lower and the cost of being wrong may be higher.
Inside the regime layer there can also be internal tension: spot and futures flows disagreeing, or general aggression and whale delta pointing opposite ways. Our earlier articles on netflow and Taker Net Flow cover those cases. Treat them as one more reason to lower your confidence.
The Five-Step Checklist
Run these in order whenever the layers disagree. The order follows how quickly each layer tends to change.
1. Which layer is fresher, and do the two timeframes agree?
Read both the 4H and the daily timeframe. If the conflict exists only on the 4H while the daily still supports the regime, the 4H may be an early signal of change or just noise; if the daily has turned too, the conflict is more serious. Record the intensity of the flows (normal, heavy, very heavy) rather than raw numbers. Heavy readings on both timeframes deserve more weight than a heavy reading on one.
2. What does whale delta say?
In our model whale delta carries more weight than the other flow indicators, which makes it a natural tiebreaker. If whale delta supports the scenario, the conflict is weaker than it looks. If it supports the regime, the scenario deserves more suspicion. If it is "normal", it adds no information; move on. Remember this weighting is a modeling choice, not a law of the market: a large player may be hedging or arbitraging.
3. Do the indicators agree with each other?
Look at the other indicators that make up the scenario, beyond whale delta from step 2: price action with RSI, CVD, open interest and funding rate (liquidations are useful context too). This step checks the internal consistency of the scenario. A rise with open interest growing and CVD confirming is healthier than a rise with falling CVD and crowded funding. Count how many agree with the scenario and how many lean against it; a scenario whose own indicators disagree deserves less confidence.
4. Does price structure and liquidity confirm?
Ask whether price is holding or losing the key level, and where the liquidity sits: resting stops, a heatmap cluster just beyond your stop, a recent sweep. A scenario that price structure confirms is stronger. If price cannot hold the level the scenario depends on, the conflict is resolving against it. Place the stop where the idea is invalidated, not where it is comfortable.
5. How much does it cost if I am wrong?
Measure the distance to the stop, and think about position size in relation to it. A conflicting picture usually means lower confidence, and lower confidence should show up as a smaller size, not as a bigger bet to "make up" for doubt. Position sizing and risk management are a topic of their own, covered in the next article.
Four Possible Decisions
Decision: Enter — When it fits: Regime and scenario agree, both timeframes align, whale delta and the scenario's indicators agree, price structure confirms, and the stop distance is acceptable.
Decision: Enter with reduced size — When it fits: The layers mostly agree but one element conflicts (for example one timeframe or one of the scenario's indicators). The idea is valid but confidence is lower.
Decision: Wait — When it fits: The layers conflict and whale delta does not break the tie, or the regime is clear with no scenario, or price has not yet confirmed. Waiting is a position too.
Decision: Reduce or exit — When it fits: You are already in, and the regime, whale delta and price structure have turned against the position. Protect capital first.
None of these is better than the others in general. Each is the right answer in some situation.
A Step-by-Step Example
Suppose price breaks above a resistance level and a bullish breakout scenario appears.
1. Timeframes: the 4H flow is heavy and positive, but the daily is only normal and leaning the other way. The regime is not yet supportive; the layers conflict.
2. Whale delta: positive on the 4H, normal on the daily. It leans toward the scenario but is not decisive.
3. Indicator agreement: open interest is rising, funding is mildly positive, CVD confirms the break. Mostly supportive, with funding worth watching.
4. Structure and liquidity: price has closed above the level on the 4H but has not retested it. A liquidity cluster sits just beneath the broken level, so a sweep back is possible.
5. Cost: the invalidation point is reasonably close, so the distance to the stop is acceptable.
Result: the idea has support, but the daily timeframe has not confirmed and structure is not yet tested. The reasonable decision is a reduced size, with a plan to add only if price holds the level and the daily flow turns supportive, and to exit if the level fails. This is an illustration of the process, not a signal.
Common Mistakes
Choosing the layer you like. Picking whichever layer agrees with the trade you already wanted defeats the purpose of the checklist.
Overweighting a single indicator. One dramatic reading does not outvote the rest. Check alignment.
Ignoring the conflict in the hope it fixes itself. Conflicts sometimes resolve in your favor, but hope is not a plan. Resolve it with size or patience.
Treating "wait" as failure. Skipping an unclear setup is a decision, and often a good one.
Making the stop fit the position. The stop belongs where the idea fails, and size should then fit the stop, never the reverse.
Treating the checklist as a formula. It structures your thinking. It does not guarantee outcomes, and these ranges and methods are AxiomLens's operating framework, not a general law.
The Fewest Indicators, the Most Confidence
There are many indicators, and each affects analysis from one angle: the capital-flow regime, whale delta, CVD, open interest, funding, the heatmap. The challenge for the independent trader is not a shortage of indicators but their abundance, and above all how to weigh them when they disagree. The real craft is to reach an acceptable level of reliability for decision-making quickly, through the smart use of the fewest indicators. In line with its stated mission and vision, AxiomLens has tried to reach exactly this craft and put it in the hands of the independent analyst: it analyzes the regime, the scenario and the supporting indicators simultaneously, and builds decisions from how they align or conflict. See it at axiomlens.app.
Takeaway
Disagreement between regime and scenario is normal; it signals that the market is not speaking with one voice.
Three common forms: scenario against regime, regime without a scenario, and aligned layers with disagreeing indicators inside the scenario.
The five checks, in order: timeframe alignment (4H and daily), whale delta, agreement among the indicators, price structure and liquidity, and the cost of being wrong.
Four decisions: enter, enter with reduced size, wait, or reduce and exit.
Lower confidence should show up as smaller size or patience, never a bigger bet.
The checklist structures judgment; it does not predict outcomes.
O. H.
Founder, AxiomLens
This article is part of the AxiomLens educational series and is for education only, not financial advice. Crypto market analysis built on liquidity structure and capital flow, not prediction.