Start Here: A Reading Map for the AxiomLens Library
The AxiomLens library now holds more than forty articles. That is useful once you know where you are going and overwhelming on the first visit. This page is the map: what the library is, the single idea that connects it, three ways to read it, and a one-page routine you can reuse.
All articles are listed on the Market Pulse page.
What This Library Is, and What It Is Not
It is an educational series about analyzing crypto markets through liquidity structure and capital flow.
It is written for the independent trader who works without a team of analysts. The examples draw mostly on swing trades (roughly 1 to 20 days, on the 4H and daily timeframes), but the process is the same at any horizon: for one trader it may compress into two days, for another it may stretch over months. You choose the timeframes that fit your own holding period.
It is not prediction, a set of signals, or financial advice. The articles teach how to read evidence and how to decide with it; they never promise an outcome.
It is not a description of every internal detail of the AxiomLens application. The articles explain the ideas; the application applies them.
The Whole Idea in One Minute
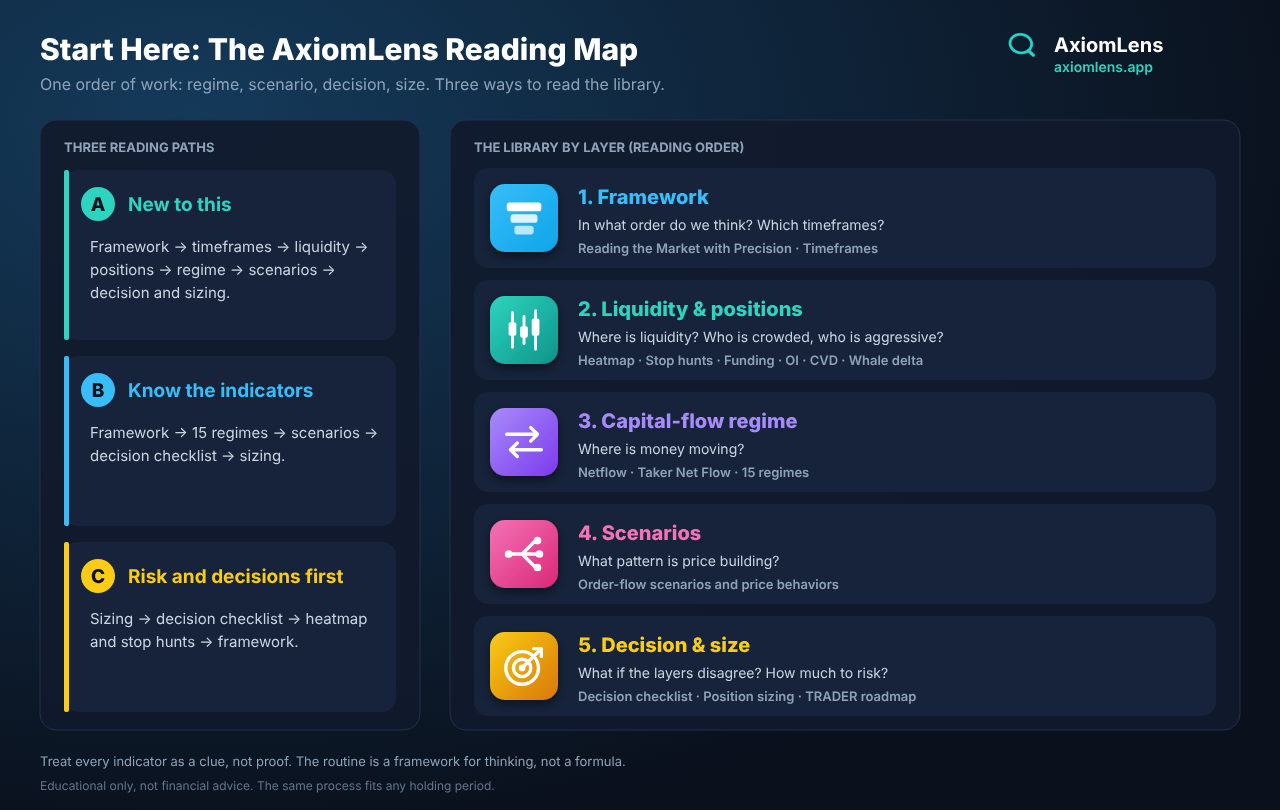
Everything in the library hangs on one order of work:
1. Regime first. What is the mood of money and liquidity over the coming days? (capital-flow regimes)
2. Scenario second. What pattern is price building right now? (order-flow scenarios and price behaviors)
3. Decision third. Do the two agree? If not, run the checklist: enter, enter smaller, wait, or reduce.
4. Size last. Where does the idea fail, and how much are you willing to lose there? The stop sets the distance and the distance sets the size.
The indicators exist to support steps one to three, and the risk rules exist to make step four survivable. The core article is Reading the Market with Precision.
Three Reading Paths
Path A: I am new to this. Read in this order:
1. Reading the Market with Precision: the framework.
2. The timeframes article: how 4H and daily fit a swing trade.
3. The heatmap, stop-hunt and funding-rate articles: where liquidity sits and how crowded the market is.
4. The open interest, CVD and whale delta articles: positions, aggression and large players.
5. The netflow and Taker Net Flow articles: the two ways to estimate the regime.
6. The scenario and regime series.
7. The decision checklist and the position-sizing article.
8. The Anatomy of a TRADER: the habits and review loop around your trades.
Path B: I already know the indicators. Go straight to the framework article, then the 15 capital-flow regimes, then the order-flow scenarios, then the decision checklist and sizing.
Path C: I want risk and decisions first. Start with position sizing, then the decision checklist, then the heatmap and stop-hunt articles for stop placement, and finish with the framework article.
The Library by Layer
Layer: Framework
What it answers: In what order do we think? Which timeframes?
Where to read: Reading the Market with Precision, Timeframes
Layer: Liquidity and positions
What it answers: Where do stops and liquidity sit? How crowded is the market? How many positions are open, who is aggressive, and what are large players doing?
Where to read: Heatmap stop and take-profit, Stop hunts, Funding rate, Open interest, CVD, Whale delta
Layer: Capital flow (regime)
What it answers: Where is money moving?
Where to read: Spot and futures netflow, Taker Net Flow, the 15 capital-flow regimes
Layer: Scenarios
What it answers: What pattern is price building?
Where to read: The order-flow scenarios and price-behavior series
Layer: Decision and risk
What it answers: What do we do when layers disagree? How much do we risk?
Where to read: Regime and scenario disagree, Position sizing and risk, The Anatomy of a TRADER
A One-Page Routine for a Trade
Use this as a repeatable sequence. It is a framework for thinking, not a formula, and the methods and ranges are AxiomLens's operating framework, not a general law.
1. Fix the frame: choose timeframes that fit your own holding period (the examples use 4H and daily for a 1 to 20 day hold).
2. Estimate the regime: from netflow or Taker Net Flow together with whale delta, recorded as normal, heavy or very heavy.
3. Look for the scenario: which order-flow pattern is price showing?
4. Compare the layers: if they agree, continue; if not, run the five-check decision checklist.
5. Check the supporting indicators: funding, open interest, CVD and liquidations, to judge the quality of the move.
6. Read structure and liquidity: place the stop where the idea fails, mindful of liquidity clusters.
7. Size and decide: risk budget ÷ stop distance gives the size; then choose to enter, enter smaller, wait, or reduce.
This routine covers a single trade. For the bigger picture around it, from managing your time and building a daily habit to reviewing your results, read The Anatomy of a TRADER.
A Short Glossary
Taker / maker: the taker hits a resting order with a market order; the maker placed the resting limit order.
Delta: aggressive buying minus aggressive selling over a period.
CVD: the running total of delta.
Taker Net Flow: the delta of each window; the change in CVD over that window.
Netflow: assets moving onto or off exchanges; potential supply, not proof of selling.
Whale delta: an attempt to isolate the aggression of large trades; carries more weight in our model.
Open interest (OI): the number of open derivative contracts.
Funding rate: the periodic payment between longs and shorts on perpetuals; a gauge of crowding.
Liquidation: a forced closing of a leveraged position.
Heatmap: a map of where liquidation and stop liquidity may sit.
Stop hunt: a move into a cluster of stops that reverses; evidence needs care.
Regime: the dominant capital-flow and liquidity backdrop.
Scenario: the order-flow pattern price is building.
Intensity: a record of normal, heavy or very heavy relative to the past 30 days.
Alignment: agreement between timeframes or layers.
Invalidation: the level at which the idea is shown to be wrong; where the stop belongs.
Risk budget: the amount you accept to lose if the stop is hit.
R (reward-to-risk): distance to target divided by distance to stop.
Divergence: price and an indicator moving in different directions.
Absorption: passive orders soaking up aggression without price moving.
How to Read the Articles
Each article ends with a takeaway list. Read those first if you only want the summary.
Examples are illustrative and use made-up numbers. They show a process, not a signal.
Read the indicators as clues, not proof. None of them proves anyone's intent, and the articles say so.
Come back to the routine above after each article and ask which step it improved.
The Fewest Indicators, the Most Confidence
There are many indicators, and each affects analysis from one angle. The challenge for the independent trader is not a shortage of them but their abundance, and how to turn their agreement or conflict into a decision. The real craft is to reach an acceptable level of reliability for decision-making quickly, through the smart use of the fewest indicators. In line with its stated mission and vision, AxiomLens has tried to reach exactly this craft and put it in the hands of the independent analyst: it analyzes the regime, the scenario and the supporting indicators simultaneously, and builds decisions from how they align or conflict. See it at axiomlens.app.
Takeaway
The library teaches one order of work: regime, scenario, decision, size.
The examples draw on swing trades (1 to 20 days, 4H and daily), but the process fits any holding period. The library is educational, not predictive.
Choose a path: new to this, indicator-savvy, or risk-first.
The seven-step routine is a framework for thinking, not a formula.
Treat every indicator as a clue, not proof.
O. H.
Founder, AxiomLens